| Param | Original file | Final file |
|---|---|---|
| Filename | modeM0/AS1A04_176T01_9000001786cztM0_level2_bc.evt | modeM0/AS1A04_176T01_9000001786cztM0_level2_quad_clean.evt |
| Size (bytes) | 1,631,975,040 | 495,123,840 |
| Size | 1.5 GB | 472.2 MB |
| Events in quadrant A | 8,597,433 | 3,186,259 |
| Events in quadrant B | 17,431,630 | 3,040,574 |
| Events in quadrant C | 7,456,166 | 3,111,236 |
| Events in quadrant D | 13,288,775 | 2,988,430 |
| Mode M9 | |||
|---|---|---|---|
| Quadrant | BADHDUFLAG | Total packets | Discarded packets |
| A | 0 | 54 | 0 |
| B | 0 | 54 | 0 |
| C | 0 | 54 | 0 |
| D | 0 | 54 | 0 |
| Mode M0 | |||
|---|---|---|---|
| Quadrant | BADHDUFLAG | Total packets | Discarded packets |
| A | 0 | 82756 | 0 |
| B | 0 | 117550 | 0 |
| C | 0 | 79273 | 0 |
| D | 0 | 97235 | 0 |
| Mode SS | |||
|---|---|---|---|
| Quadrant | BADHDUFLAG | Total packets | Discarded packets |
| A | 0 | 790 | 0 |
| B | 0 | 790 | 0 |
| C | 0 | 790 | 0 |
| D | 0 | 790 | 0 |
| Quadrant | Total seconds | Saturated seconds | Saturation percentage |
|---|---|---|---|
| A | 38880 | 490 | 1.260288% |
| B | 38880 | 2730 | 7.021605% |
| C | 38880 | 230 | 0.591564% |
| D | 38880 | 1341 | 3.449074% |
Noise dominated data is calculated using 1-second bins in cleaned event files. If a bin has >2000 counts, and if more than 50% of those come from <1% of pixels, then it is considered to be noise-dominated and hence unusable.
| Quadrant | # 1 sec bins | Bins with >0 counts | Bins with >2000 counts | High rate bins dominated by noise | Noise dominated (total time) | Noise dominated (detector-on time) | Marked lightcurve |
|---|---|---|---|---|---|---|---|
| A | 44221 | 38874 | 8 | 8 | 0.02% | 0.02% |  |
| B | 44221 | 38875 | 72 | 72 | 0.16% | 0.19% | 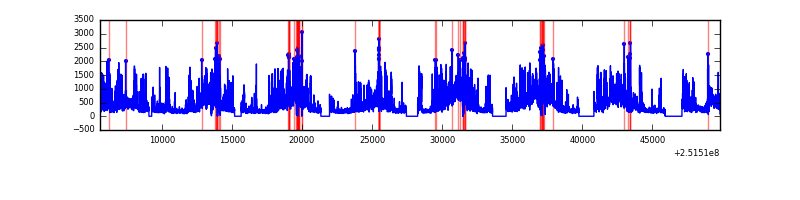 |
| C | 44221 | 38879 | 0 | 0 | 0.00% | 0.00% |  |
| D | 44221 | 38877 | 246 | 246 | 0.56% | 0.63% | 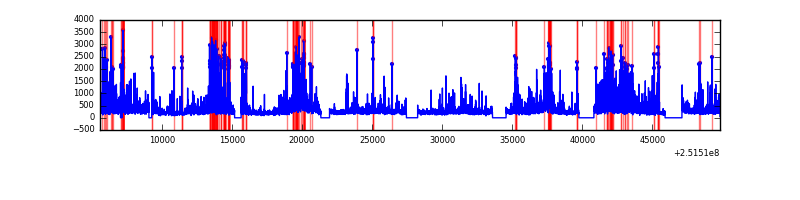 |
Top three noisy pixels from each quadrant. If the there are fewer than three noisy pixels in the level2.evt file, extra rows are filled as -1
| Pixel properties | Quadrant properties | ||||||
|---|---|---|---|---|---|---|---|
| Quadrant | DetID | PixID | Counts | Sigma | Mean | Median | Sigma |
| A | 15 | 239 | 244246 | 568.91 | 1968 | 1931 | 425.9 |
| A | 13 | 251 | 223552 | 520.33 | 1968 | 1931 | 425.9 |
| A | 1 | 162 | 209024 | 486.22 | 1968 | 1931 | 425.9 |
| B | 4 | 206 | 4970602 | 13694.54 | 1905 | 1856 | 362.8 |
| B | 4 | 239 | 4180931 | 11518.1 | 1905 | 1856 | 362.8 |
| B | 15 | 204 | 441805 | 1212.56 | 1905 | 1856 | 362.8 |
| C | 0 | 207 | 24592 | 53.79 | 1896 | 1861 | 422.6 |
| C | 14 | 234 | 18475 | 39.31 | 1896 | 1861 | 422.6 |
| C | 13 | 61 | 11512 | 22.84 | 1896 | 1861 | 422.6 |
| D | 1 | 52 | 3842362 | 8793.03 | 1890 | 1821 | 436.8 |
| D | 8 | 195 | 1233630 | 2820.26 | 1890 | 1821 | 436.8 |
| D | 10 | 199 | 185641 | 420.86 | 1890 | 1821 | 436.8 |
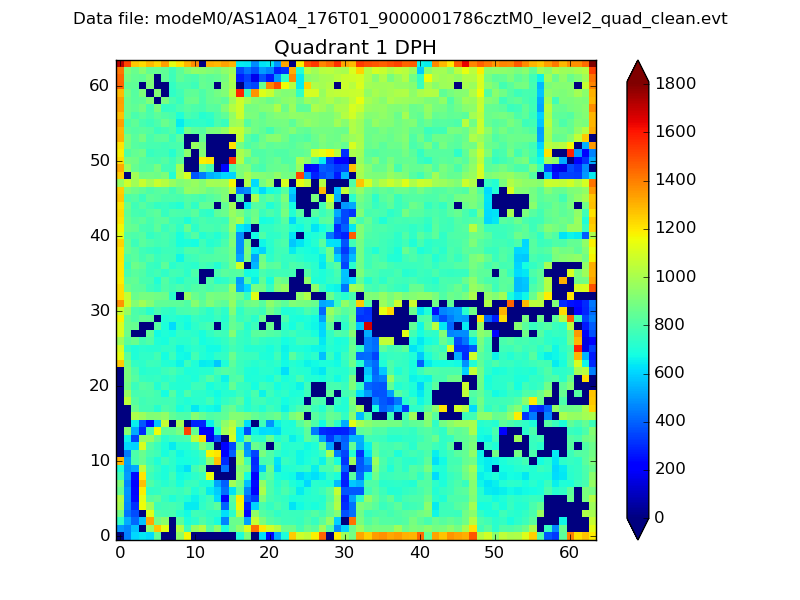
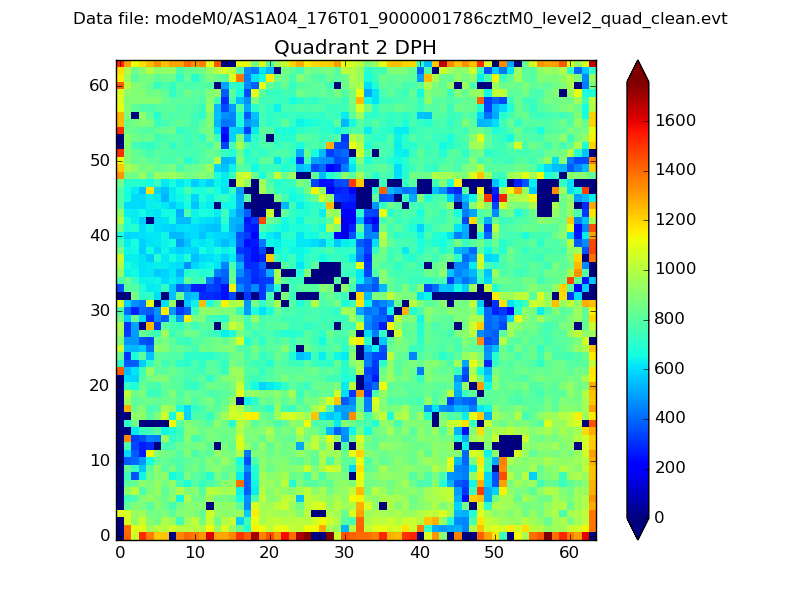
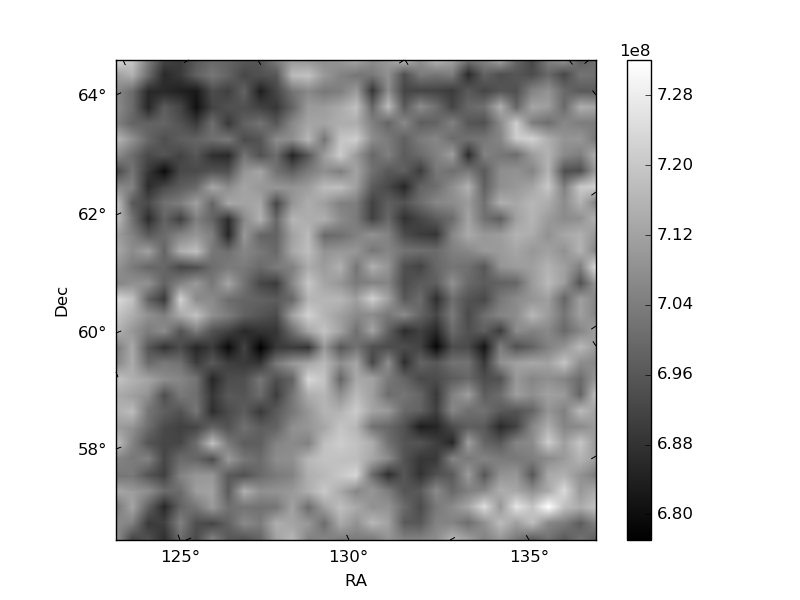
Histogram calculated using DETX and DETY for each event in the final _common_clean file
| Quadrant A |  |
 |
Quadrant B |
|---|---|---|---|
| Quadrant D |  |
 |
Quadrant C |
| Plot type | Count rate plots | Images |
|---|---|---|
| Comparison with Poisson distribution Blue bars denote a histogram of data divided into 1 sec bins. Red curve is a Poisson curve with rate = median count rate of data. |
 |
 |
| Quadrant-wise count rates Data is divided into 100 sec bins |
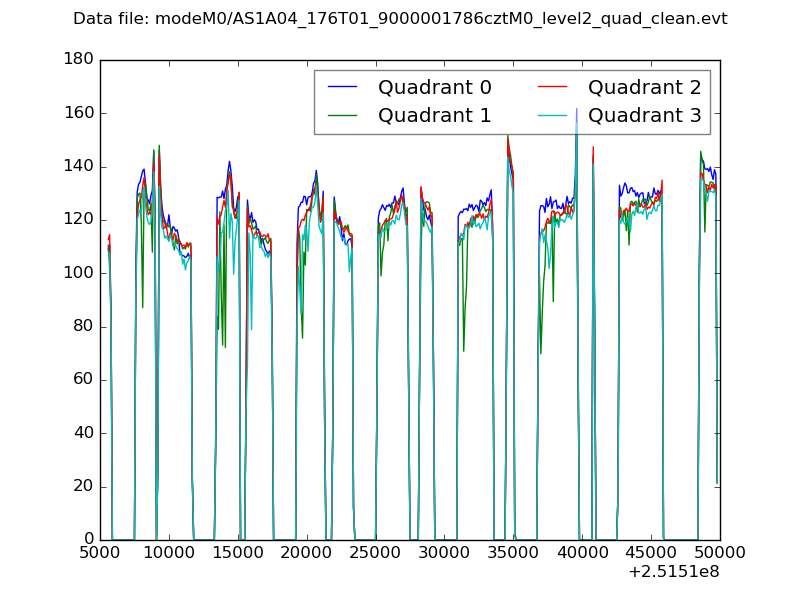 |
|
| Module-wise count rates for Quadrant A Data is divided into 100 sec bins |
 |
 |
| Module-wise count rates for Quadrant B Data is divided into 100 sec bins |
 |
 |
| Module-wise count rates for Quadrant C Data is divided into 100 sec bins |
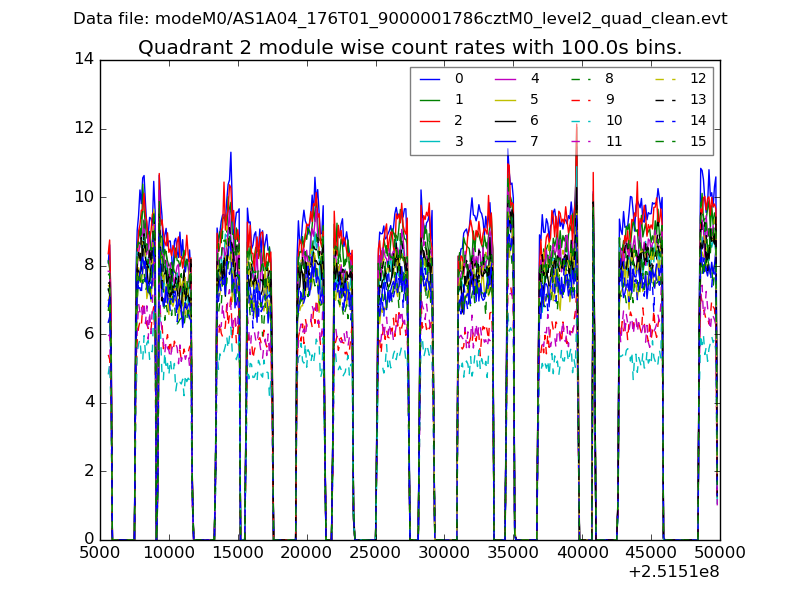 |
 |
| Module-wise count rates for Quadrant D Data is divided into 100 sec bins |
 |
 |
| Parameter | Plot |
|---|---|
| CZT HV Monitor |  |
| D_VDD |  |
| Temperature 1 |  |
| Veto HV Monitor |  |
| Veto LLD | 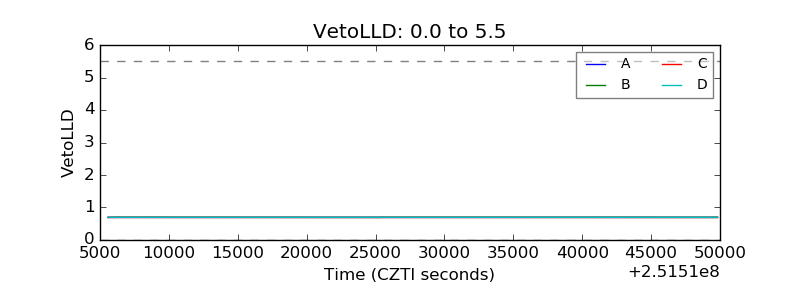 |
| Alpha Counter | 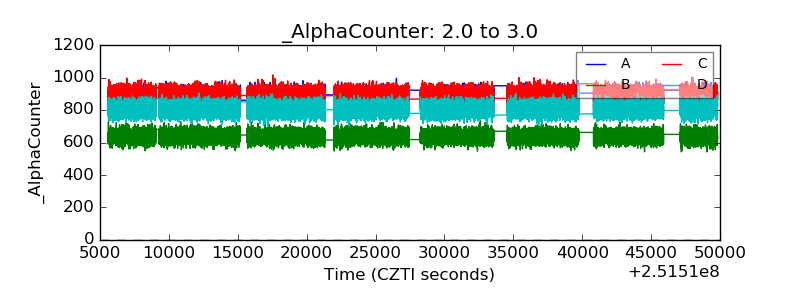 |
| _CPM_Rate |  |
| CZT Counter | 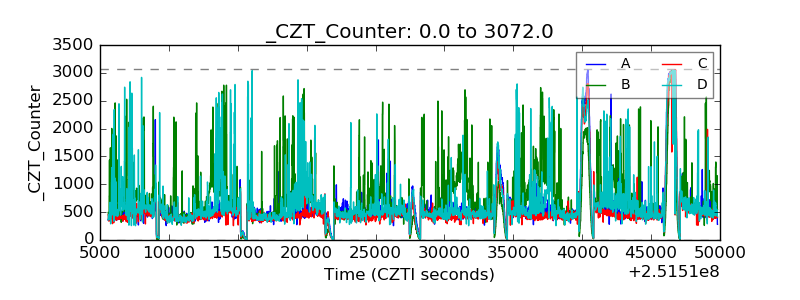 |
| +2.5 Volts monitor |  |
| +5 Volts monitor |  |
| _ROLL_ROT |  |
| _Roll_DEC |  |
| _Roll_RA |  |
| Veto Counter |  |