| Param | Original file | Final file |
|---|---|---|
| Filename | modeM0/AS1A04_145T02_9000001790cztM0_level2_bc.evt | modeM0/AS1A04_145T02_9000001790cztM0_level2_quad_clean.evt |
| Size (bytes) | 256,530,240 | 107,245,440 |
| Size | 244.6 MB | 102.3 MB |
| Events in quadrant A | 1,489,787 | 712,798 |
| Events in quadrant B | 1,953,621 | 704,967 |
| Events in quadrant C | 1,353,588 | 713,475 |
| Events in quadrant D | 2,542,106 | 683,760 |
| Mode M9 | |||
|---|---|---|---|
| Quadrant | BADHDUFLAG | Total packets | Discarded packets |
| A | 0 | 22 | 0 |
| B | 0 | 22 | 0 |
| C | 0 | 22 | 0 |
| D | 0 | 22 | 0 |
| Mode SS | |||
|---|---|---|---|
| Quadrant | BADHDUFLAG | Total packets | Discarded packets |
| A | 0 | 126 | 0 |
| B | 0 | 126 | 0 |
| C | 0 | 126 | 0 |
| D | 0 | 126 | 0 |
| Mode M0 | |||
|---|---|---|---|
| Quadrant | BADHDUFLAG | Total packets | Discarded packets |
| A | 0 | 13641 | 0 |
| B | 0 | 15743 | 0 |
| C | 0 | 12838 | 0 |
| D | 0 | 16519 | 0 |
| Quadrant | Total seconds | Saturated seconds | Saturation percentage |
|---|---|---|---|
| A | 6204 | 75 | 1.208897% |
| B | 6204 | 259 | 4.174726% |
| C | 6204 | 56 | 0.902643% |
| D | 6204 | 190 | 3.062540% |
Noise dominated data is calculated using 1-second bins in cleaned event files. If a bin has >2000 counts, and if more than 50% of those come from <1% of pixels, then it is considered to be noise-dominated and hence unusable.
| Quadrant | # 1 sec bins | Bins with >0 counts | Bins with >2000 counts | High rate bins dominated by noise | Noise dominated (total time) | Noise dominated (detector-on time) | Marked lightcurve |
|---|---|---|---|---|---|---|---|
| A | 7474 | 6204 | 3 | 3 | 0.04% | 0.05% |  |
| B | 7474 | 6203 | 3 | 3 | 0.04% | 0.05% |  |
| C | 7474 | 6204 | 0 | 0 | 0.00% | 0.00% |  |
| D | 7474 | 6204 | 41 | 41 | 0.55% | 0.66% | 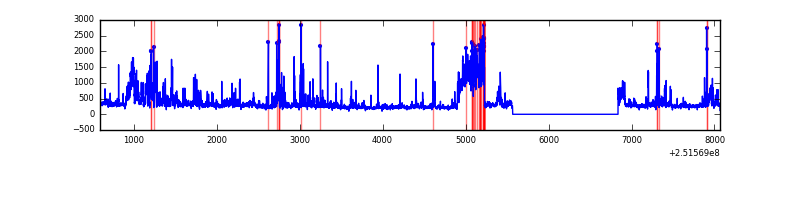 |
Top three noisy pixels from each quadrant. If the there are fewer than three noisy pixels in the level2.evt file, extra rows are filled as -1
| Pixel properties | Quadrant properties | ||||||
|---|---|---|---|---|---|---|---|
| Quadrant | DetID | PixID | Counts | Sigma | Mean | Median | Sigma |
| A | 1 | 162 | 41005 | 529.62 | 345 | 339 | 76.8 |
| A | 13 | 248 | 35415 | 456.82 | 345 | 339 | 76.8 |
| A | 13 | 251 | 20519 | 262.82 | 345 | 339 | 76.8 |
| B | 4 | 239 | 427332 | 6356.53 | 343 | 335 | 67.2 |
| B | 15 | 204 | 129272 | 1919.43 | 343 | 335 | 67.2 |
| B | 3 | 209 | 22618 | 331.72 | 343 | 335 | 67.2 |
| C | 12 | 4 | 7073 | 87.83 | 342 | 339 | 76.7 |
| C | 0 | 207 | 6415 | 79.25 | 342 | 339 | 76.7 |
| C | 13 | 61 | 2113 | 23.14 | 342 | 339 | 76.7 |
| D | 1 | 52 | 762265 | 9337.37 | 342 | 331 | 81.6 |
| D | 8 | 195 | 146128 | 1786.72 | 342 | 331 | 81.6 |
| D | 14 | 34 | 86980 | 1061.87 | 342 | 331 | 81.6 |
Histogram calculated using DETX and DETY for each event in the final _common_clean file
| Quadrant A | 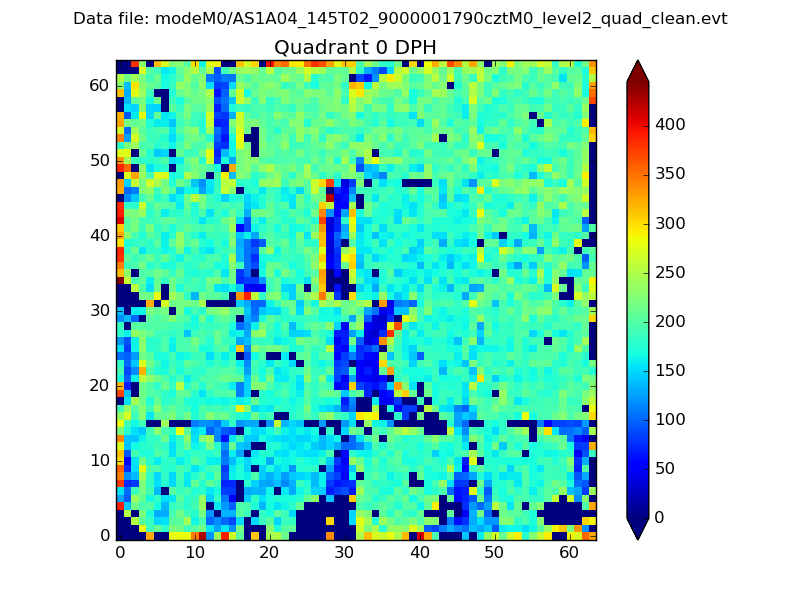 |
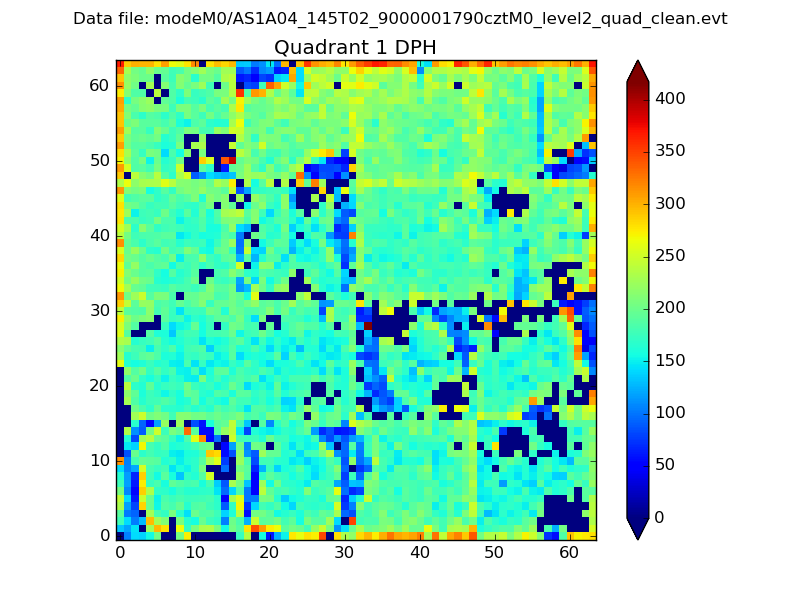 |
Quadrant B |
|---|---|---|---|
| Quadrant D | 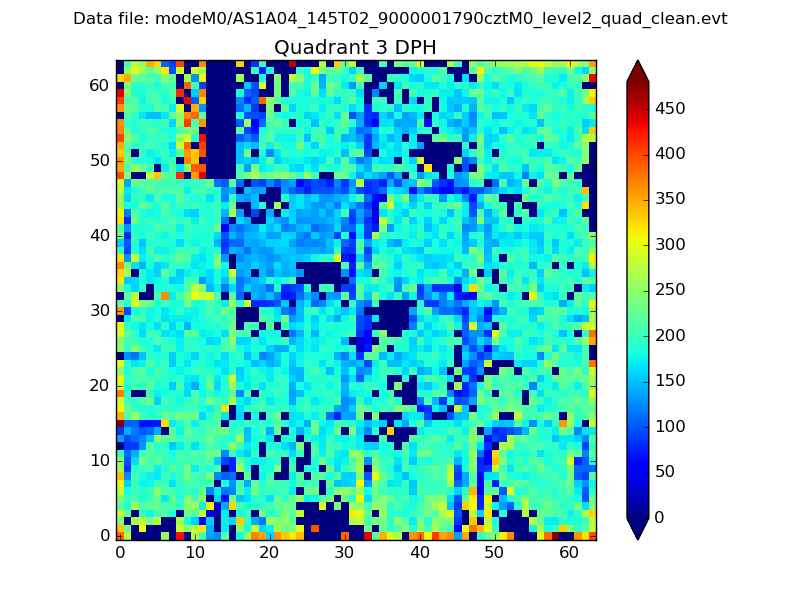 |
 |
Quadrant C |
| Plot type | Count rate plots | Images |
|---|---|---|
| Comparison with Poisson distribution Blue bars denote a histogram of data divided into 1 sec bins. Red curve is a Poisson curve with rate = median count rate of data. |
 |
 |
| Quadrant-wise count rates Data is divided into 100 sec bins |
 |
|
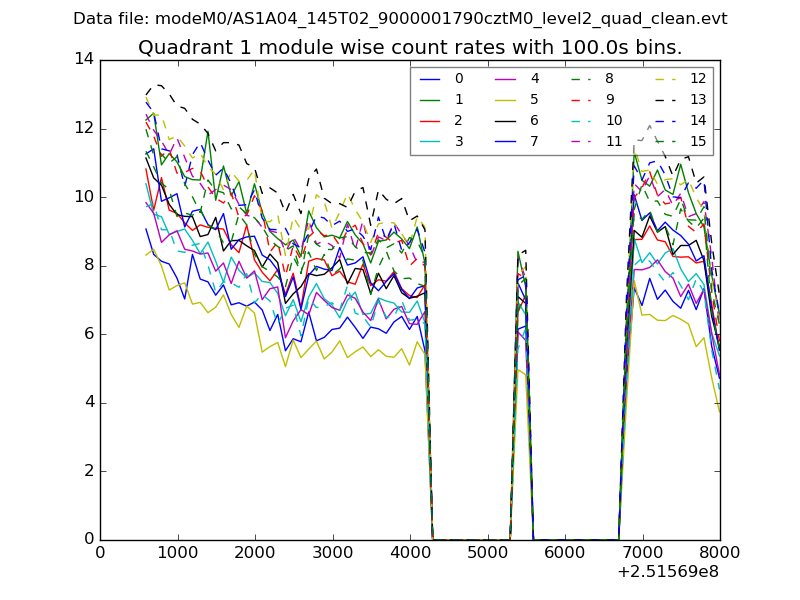
| Module-wise count rates for Quadrant A Data is divided into 100 sec bins |
 |
 |
| Module-wise count rates for Quadrant B Data is divided into 100 sec bins |
 |
 |
| Module-wise count rates for Quadrant C Data is divided into 100 sec bins |
 |
 |
| Module-wise count rates for Quadrant D Data is divided into 100 sec bins |
 |
 |
| Parameter | Plot |
|---|---|
| CZT HV Monitor |  |
| D_VDD | 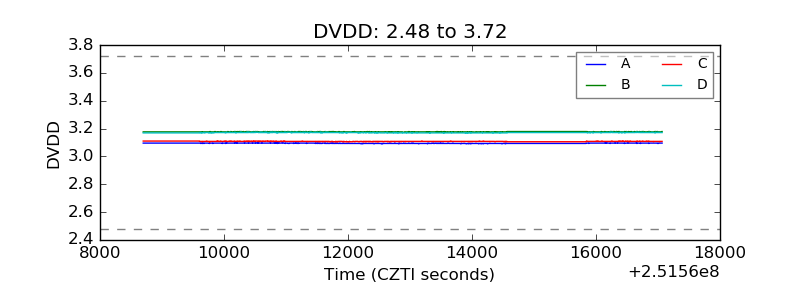 |
| Temperature 1 |  |
| Veto HV Monitor | 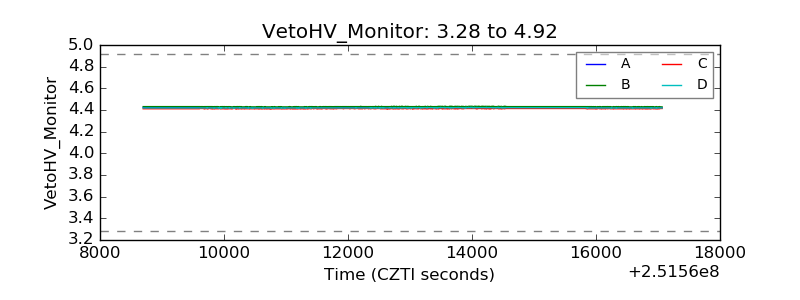 |
| Veto LLD |  |
| Alpha Counter | 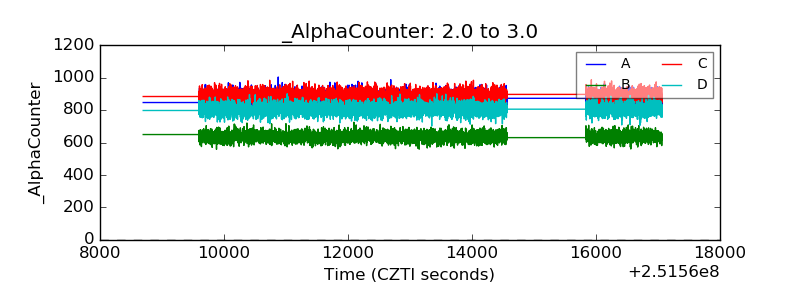 |
| _CPM_Rate |  |
| CZT Counter |  |
| +2.5 Volts monitor |  |
| +5 Volts monitor |  |
| _ROLL_ROT | 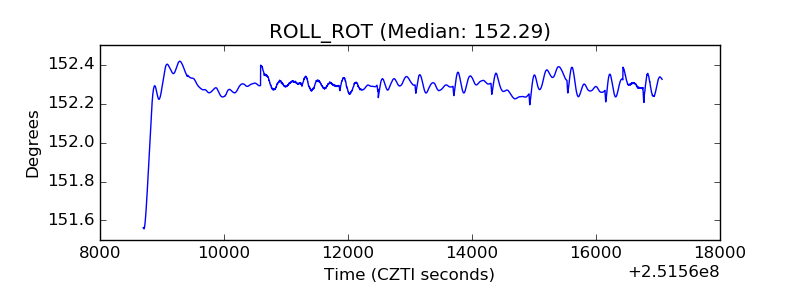 |
| _Roll_DEC | 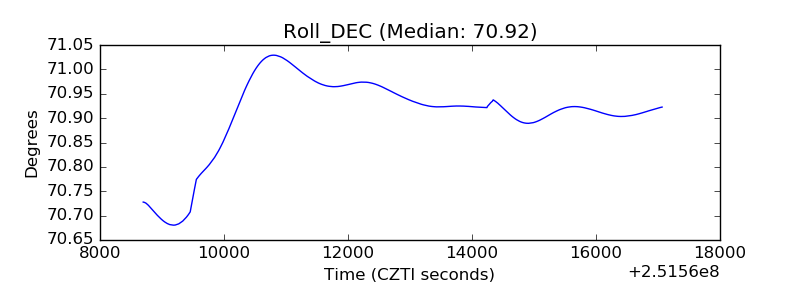 |
| _Roll_RA |  |
| Veto Counter |  |