| Param | Original file | Final file |
|---|---|---|
| Filename | modeM0/AS1A04_130T01_9000001792cztM0_level2_bc.evt | modeM0/AS1A04_130T01_9000001792cztM0_level2_quad_clean.evt |
| Size (bytes) | 1,637,735,040 | 501,344,640 |
| Size | 1.5 GB | 478.1 MB |
| Events in quadrant A | 8,889,387 | 3,116,705 |
| Events in quadrant B | 14,314,438 | 3,043,109 |
| Events in quadrant C | 8,745,956 | 3,140,877 |
| Events in quadrant D | 14,734,697 | 2,949,889 |
| Mode M0 | |||
|---|---|---|---|
| Quadrant | BADHDUFLAG | Total packets | Discarded packets |
| A | 0 | 90241 | 0 |
| B | 0 | 113536 | 0 |
| C | 0 | 88572 | 0 |
| D | 0 | 108505 | 0 |
| Mode SS | |||
|---|---|---|---|
| Quadrant | BADHDUFLAG | Total packets | Discarded packets |
| A | 0 | 866 | 0 |
| B | 0 | 866 | 0 |
| C | 0 | 866 | 0 |
| D | 0 | 866 | 0 |
| Mode M9 | |||
|---|---|---|---|
| Quadrant | BADHDUFLAG | Total packets | Discarded packets |
| A | 0 | 41 | 0 |
| B | 0 | 41 | 0 |
| C | 0 | 41 | 0 |
| D | 0 | 41 | 0 |
| Quadrant | Total seconds | Saturated seconds | Saturation percentage |
|---|---|---|---|
| A | 42735 | 452 | 1.057681% |
| B | 42735 | 2382 | 5.573886% |
| C | 42735 | 169 | 0.395460% |
| D | 42735 | 1529 | 3.577864% |
Noise dominated data is calculated using 1-second bins in cleaned event files. If a bin has >2000 counts, and if more than 50% of those come from <1% of pixels, then it is considered to be noise-dominated and hence unusable.
| Quadrant | # 1 sec bins | Bins with >0 counts | Bins with >2000 counts | High rate bins dominated by noise | Noise dominated (total time) | Noise dominated (detector-on time) | Marked lightcurve |
|---|---|---|---|---|---|---|---|
| A | 46691 | 42735 | 2 | 2 | 0.00% | 0.00% |  |
| B | 46691 | 42734 | 23 | 23 | 0.05% | 0.05% |  |
| C | 46691 | 42737 | 0 | 0 | 0.00% | 0.00% | 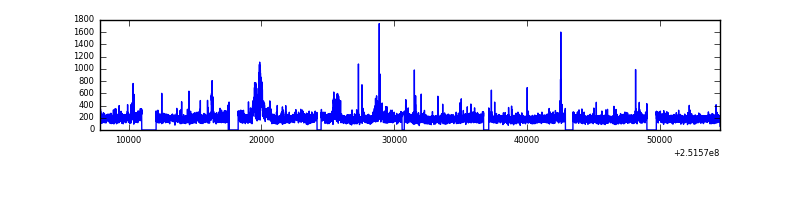 |
| D | 46691 | 42733 | 306 | 306 | 0.66% | 0.72% |  |
Top three noisy pixels from each quadrant. If the there are fewer than three noisy pixels in the level2.evt file, extra rows are filled as -1
| Pixel properties | Quadrant properties | ||||||
|---|---|---|---|---|---|---|---|
| Quadrant | DetID | PixID | Counts | Sigma | Mean | Median | Sigma |
| A | 1 | 162 | 179182 | 389.98 | 2091 | 2045 | 454.2 |
| A | 13 | 251 | 154469 | 335.57 | 2091 | 2045 | 454.2 |
| A | 3 | 1 | 149329 | 324.25 | 2091 | 2045 | 454.2 |
| B | 4 | 239 | 4524041 | 11402.36 | 2061 | 1997 | 396.6 |
| B | 15 | 204 | 552263 | 1387.5 | 2061 | 1997 | 396.6 |
| B | 0 | 231 | 428326 | 1074.99 | 2061 | 1997 | 396.6 |
| C | 8 | 208 | 564665 | 1229.05 | 2073 | 2041 | 457.8 |
| C | 14 | 234 | 22039 | 43.69 | 2073 | 2041 | 457.8 |
| C | 0 | 207 | 19010 | 37.07 | 2073 | 2041 | 457.8 |
| D | 1 | 52 | 3962102 | 8247.69 | 2059 | 1982 | 480.1 |
| D | 8 | 195 | 1526760 | 3175.64 | 2059 | 1982 | 480.1 |
| D | 14 | 34 | 244185 | 504.43 | 2059 | 1982 | 480.1 |
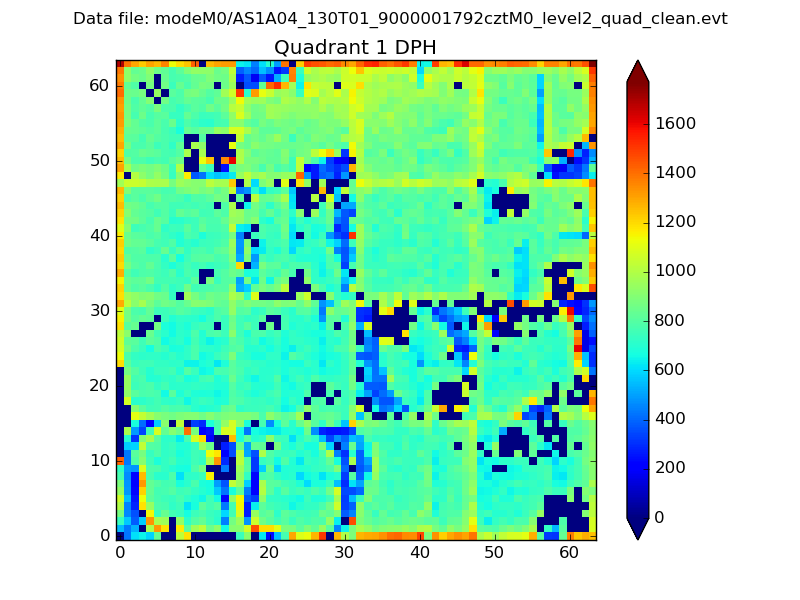
Histogram calculated using DETX and DETY for each event in the final _common_clean file
| Quadrant A |  |
 |
Quadrant B |
|---|---|---|---|
| Quadrant D |  |
 |
Quadrant C |
| Plot type | Count rate plots | Images |
|---|---|---|
| Comparison with Poisson distribution Blue bars denote a histogram of data divided into 1 sec bins. Red curve is a Poisson curve with rate = median count rate of data. |
 |
 |
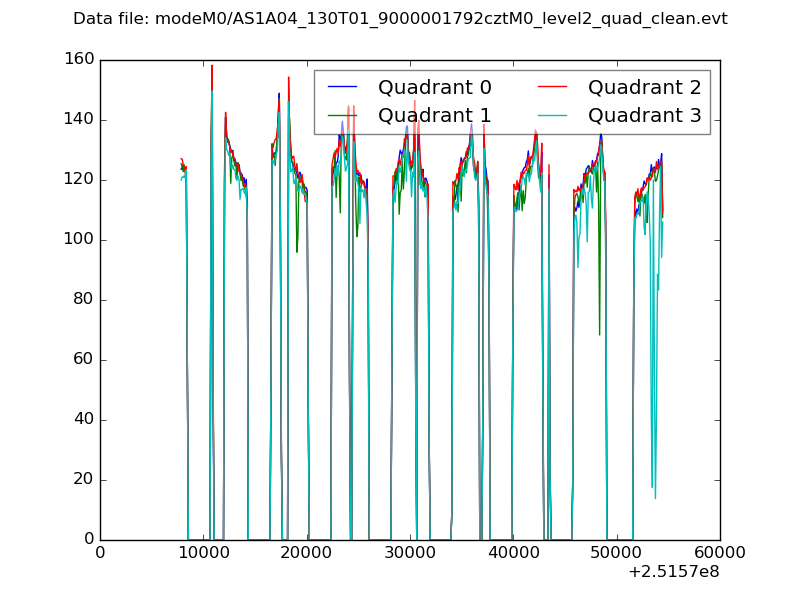
| Quadrant-wise count rates Data is divided into 100 sec bins |
 |
|
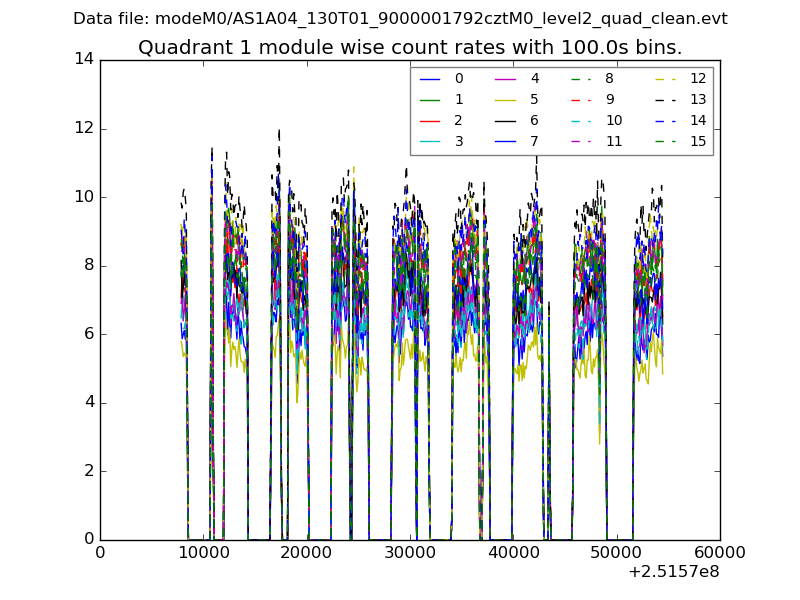
| Module-wise count rates for Quadrant A Data is divided into 100 sec bins |
 |
 |
| Module-wise count rates for Quadrant B Data is divided into 100 sec bins |
 |
 |
| Module-wise count rates for Quadrant C Data is divided into 100 sec bins |
 |
 |
| Module-wise count rates for Quadrant D Data is divided into 100 sec bins |
 |
 |
| Parameter | Plot |
|---|---|
| CZT HV Monitor |  |
| D_VDD |  |
| Temperature 1 |  |
| Veto HV Monitor | 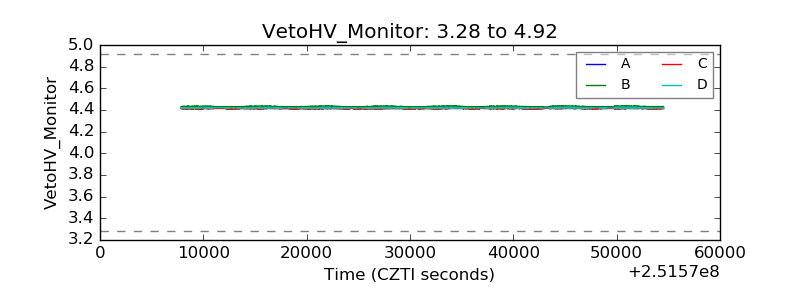 |
| Veto LLD |  |
| Alpha Counter |  |
| _CPM_Rate |  |
| CZT Counter | 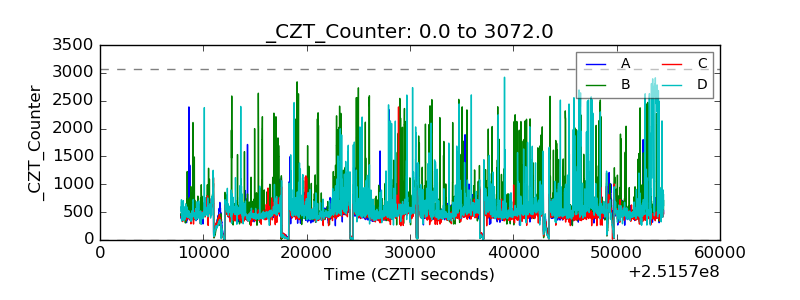 |
| +2.5 Volts monitor |  |
| +5 Volts monitor |  |
| _ROLL_ROT |  |
| _Roll_DEC |  |
| _Roll_RA |  |
| Veto Counter | 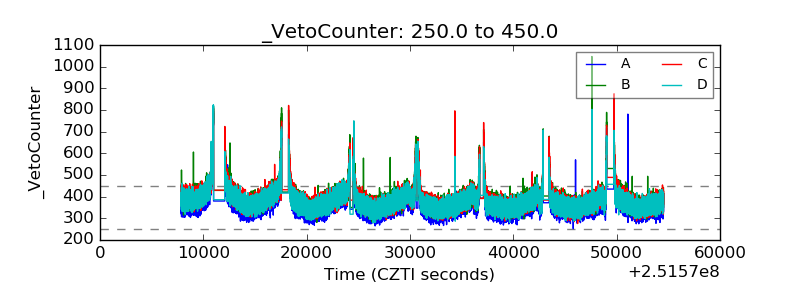 |