| Param | Original file | Final file |
|---|---|---|
| Filename | modeM0/AS1A03_085T02_9000001784cztM0_level2_bc.evt | modeM0/AS1A03_085T02_9000001784cztM0_level2_quad_clean.evt |
| Size (bytes) | 4,873,789,440 | 1,473,209,280 |
| Size | 4.5 GB | 1.4 GB |
| Events in quadrant A | 25,441,069 | 9,551,176 |
| Events in quadrant B | 48,040,309 | 9,154,815 |
| Events in quadrant C | 23,038,136 | 9,306,551 |
| Events in quadrant D | 43,244,865 | 8,715,629 |
| Mode M9 | |||
|---|---|---|---|
| Quadrant | BADHDUFLAG | Total packets | Discarded packets |
| A | 0 | 198 | 0 |
| B | 0 | 198 | 0 |
| C | 0 | 198 | 0 |
| D | 0 | 198 | 0 |
| Mode SS | |||
|---|---|---|---|
| Quadrant | BADHDUFLAG | Total packets | Discarded packets |
| A | 0 | 2346 | 0 |
| B | 0 | 2346 | 0 |
| C | 0 | 2346 | 0 |
| D | 0 | 2346 | 0 |
| Mode M0 | |||
|---|---|---|---|
| Quadrant | BADHDUFLAG | Total packets | Discarded packets |
| A | 0 | 250023 | 0 |
| B | 0 | 342845 | 0 |
| C | 0 | 238277 | 0 |
| D | 0 | 305858 | 0 |
| Quadrant | Total seconds | Saturated seconds | Saturation percentage |
|---|---|---|---|
| A | 115162 | 1739 | 1.510047% |
| B | 115162 | 10155 | 8.818013% |
| C | 115162 | 798 | 0.692937% |
| D | 115162 | 6588 | 5.720637% |
Noise dominated data is calculated using 1-second bins in cleaned event files. If a bin has >2000 counts, and if more than 50% of those come from <1% of pixels, then it is considered to be noise-dominated and hence unusable.
| Quadrant | # 1 sec bins | Bins with >0 counts | Bins with >2000 counts | High rate bins dominated by noise | Noise dominated (total time) | Noise dominated (detector-on time) | Marked lightcurve |
|---|---|---|---|---|---|---|---|
| A | 134918 | 115151 | 33 | 33 | 0.02% | 0.03% |  |
| B | 134918 | 115149 | 164 | 164 | 0.12% | 0.14% |  |
| C | 134918 | 115155 | 5 | 5 | 0.00% | 0.00% |  |
| D | 134918 | 115153 | 1781 | 1781 | 1.32% | 1.55% |  |
Top three noisy pixels from each quadrant. If the there are fewer than three noisy pixels in the level2.evt file, extra rows are filled as -1
| Pixel properties | Quadrant properties | ||||||
|---|---|---|---|---|---|---|---|
| Quadrant | DetID | PixID | Counts | Sigma | Mean | Median | Sigma |
| A | 5 | 16 | 729874 | 562.69 | 5961 | 5852 | 1286.7 |
| A | 1 | 162 | 684619 | 527.52 | 5961 | 5852 | 1286.7 |
| A | 13 | 251 | 562163 | 432.35 | 5961 | 5852 | 1286.7 |
| B | 4 | 239 | 13915057 | 12639.32 | 5807 | 5646 | 1100.5 |
| B | 0 | 85 | 5156511 | 4680.53 | 5807 | 5646 | 1100.5 |
| B | 4 | 206 | 2721421 | 2467.79 | 5807 | 5646 | 1100.5 |
| C | 14 | 234 | 190523 | 146.9 | 5771 | 5690 | 1258.3 |
| C | 7 | 247 | 185683 | 143.05 | 5771 | 5690 | 1258.3 |
| C | 0 | 207 | 56239 | 40.17 | 5771 | 5690 | 1258.3 |
| D | 1 | 52 | 15016012 | 11716.59 | 5660 | 5464 | 1281.1 |
| D | 8 | 195 | 4322451 | 3369.65 | 5660 | 5464 | 1281.1 |
| D | 13 | 104 | 550229 | 425.22 | 5660 | 5464 | 1281.1 |
Histogram calculated using DETX and DETY for each event in the final _common_clean file
| Quadrant A |  |
 |
Quadrant B |
|---|---|---|---|
| Quadrant D |  |
 |
Quadrant C |
| Plot type | Count rate plots | Images |
|---|---|---|
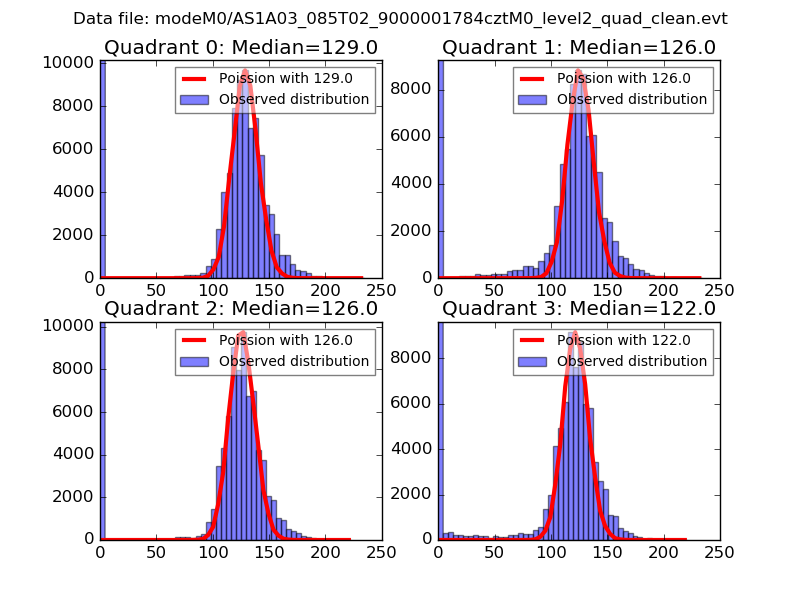
| Comparison with Poisson distribution Blue bars denote a histogram of data divided into 1 sec bins. Red curve is a Poisson curve with rate = median count rate of data. |
 |
 |
| Quadrant-wise count rates Data is divided into 100 sec bins |
 |
|
| Module-wise count rates for Quadrant A Data is divided into 100 sec bins |
 |
 |
| Module-wise count rates for Quadrant B Data is divided into 100 sec bins |
 |
 |
| Module-wise count rates for Quadrant C Data is divided into 100 sec bins |
 |
 |
| Module-wise count rates for Quadrant D Data is divided into 100 sec bins |
 |
 |
| Parameter | Plot |
|---|---|
| CZT HV Monitor |  |
| D_VDD |  |
| Temperature 1 |  |
| Veto HV Monitor |  |
| Veto LLD |  |
| Alpha Counter |  |
| _CPM_Rate |  |
| CZT Counter |  |
| +2.5 Volts monitor | 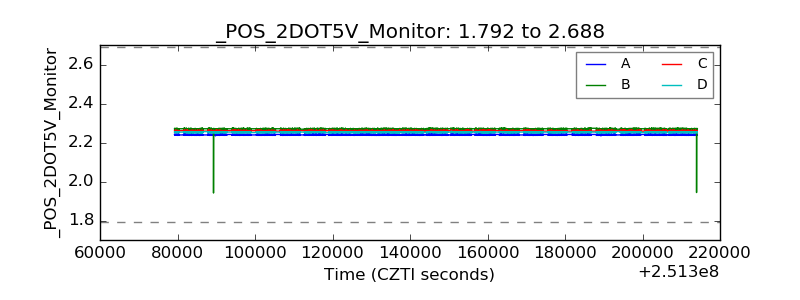 |
| +5 Volts monitor |  |
| _ROLL_ROT | 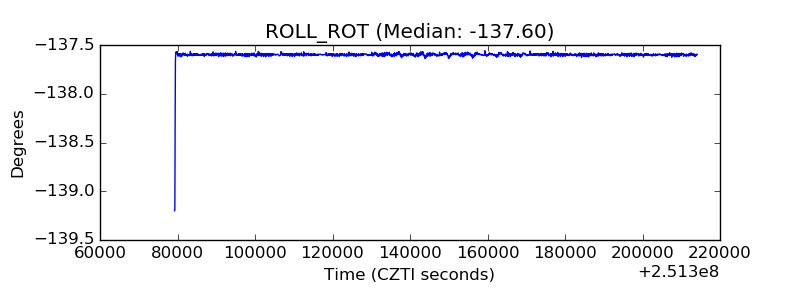 |
| _Roll_DEC |  |
| _Roll_RA |  |
| Veto Counter |  |