| Param | Original file | Final file |
|---|---|---|
| Filename | modeM0/AS1A04_075T03_9000001780cztM0_level2_bc.evt | modeM0/AS1A04_075T03_9000001780cztM0_level2_quad_clean.evt |
| Size (bytes) | 299,548,800 | 117,457,920 |
| Size | 285.7 MB | 112.0 MB |
| Events in quadrant A | 1,697,409 | 779,589 |
| Events in quadrant B | 2,558,821 | 763,556 |
| Events in quadrant C | 1,520,087 | 765,636 |
| Events in quadrant D | 2,781,951 | 731,592 |
| Mode M9 | |||
|---|---|---|---|
| Quadrant | BADHDUFLAG | Total packets | Discarded packets |
| A | 0 | 18 | 0 |
| B | 0 | 18 | 0 |
| C | 0 | 18 | 0 |
| D | 0 | 18 | 0 |
| Mode SS | |||
|---|---|---|---|
| Quadrant | BADHDUFLAG | Total packets | Discarded packets |
| A | 0 | 152 | 0 |
| B | 0 | 152 | 0 |
| C | 0 | 152 | 0 |
| D | 0 | 152 | 0 |
| Mode M0 | |||
|---|---|---|---|
| Quadrant | BADHDUFLAG | Total packets | Discarded packets |
| A | 0 | 16241 | 0 |
| B | 0 | 20055 | 0 |
| C | 0 | 15461 | 0 |
| D | 0 | 19205 | 0 |
| Quadrant | Total seconds | Saturated seconds | Saturation percentage |
|---|---|---|---|
| A | 7429 | 148 | 1.992193% |
| B | 7429 | 503 | 6.770763% |
| C | 7429 | 83 | 1.117243% |
| D | 7429 | 322 | 4.334365% |
Noise dominated data is calculated using 1-second bins in cleaned event files. If a bin has >2000 counts, and if more than 50% of those come from <1% of pixels, then it is considered to be noise-dominated and hence unusable.
| Quadrant | # 1 sec bins | Bins with >0 counts | Bins with >2000 counts | High rate bins dominated by noise | Noise dominated (total time) | Noise dominated (detector-on time) | Marked lightcurve |
|---|---|---|---|---|---|---|---|
| A | 8564 | 7428 | 3 | 3 | 0.04% | 0.04% | 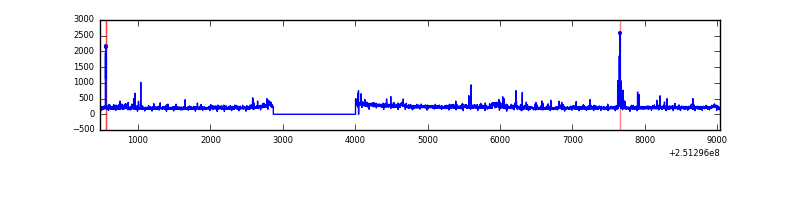 |
| B | 8564 | 7427 | 3 | 3 | 0.04% | 0.04% | 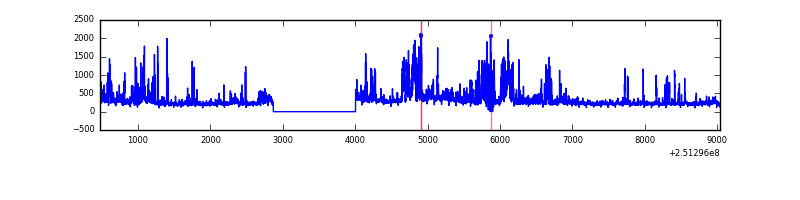 |
| C | 8564 | 7428 | 0 | 0 | 0.00% | 0.00% |  |
| D | 8564 | 7428 | 25 | 25 | 0.29% | 0.34% | 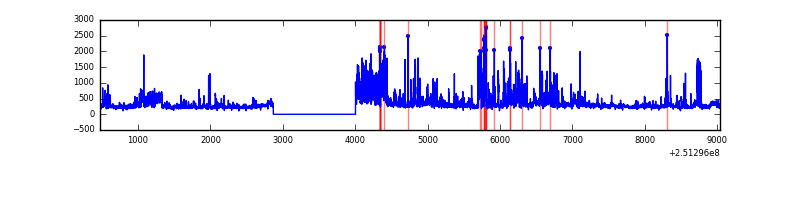 |
Top three noisy pixels from each quadrant. If the there are fewer than three noisy pixels in the level2.evt file, extra rows are filled as -1
| Pixel properties | Quadrant properties | ||||||
|---|---|---|---|---|---|---|---|
| Quadrant | DetID | PixID | Counts | Sigma | Mean | Median | Sigma |
| A | 13 | 251 | 56583 | 625.7 | 398 | 390 | 89.8 |
| A | 1 | 162 | 52848 | 584.12 | 398 | 390 | 89.8 |
| A | 4 | 2 | 29724 | 326.63 | 398 | 390 | 89.8 |
| B | 4 | 239 | 369853 | 4872.41 | 390 | 382 | 75.8 |
| B | 0 | 85 | 294037 | 3872.58 | 390 | 382 | 75.8 |
| B | 15 | 204 | 138558 | 1822.2 | 390 | 382 | 75.8 |
| C | 13 | 250 | 2466 | 23.96 | 386 | 380 | 87.0 |
| C | 0 | 207 | 2463 | 23.93 | 386 | 380 | 87.0 |
| C | 13 | 61 | 2341 | 22.53 | 386 | 380 | 87.0 |
| D | 1 | 52 | 468287 | 5223.89 | 383 | 370 | 89.6 |
| D | 4 | 95 | 351560 | 3920.73 | 383 | 370 | 89.6 |
| D | 8 | 195 | 212033 | 2363.03 | 383 | 370 | 89.6 |
Histogram calculated using DETX and DETY for each event in the final _common_clean file
| Quadrant A |  |
 |
Quadrant B |
|---|---|---|---|
| Quadrant D | 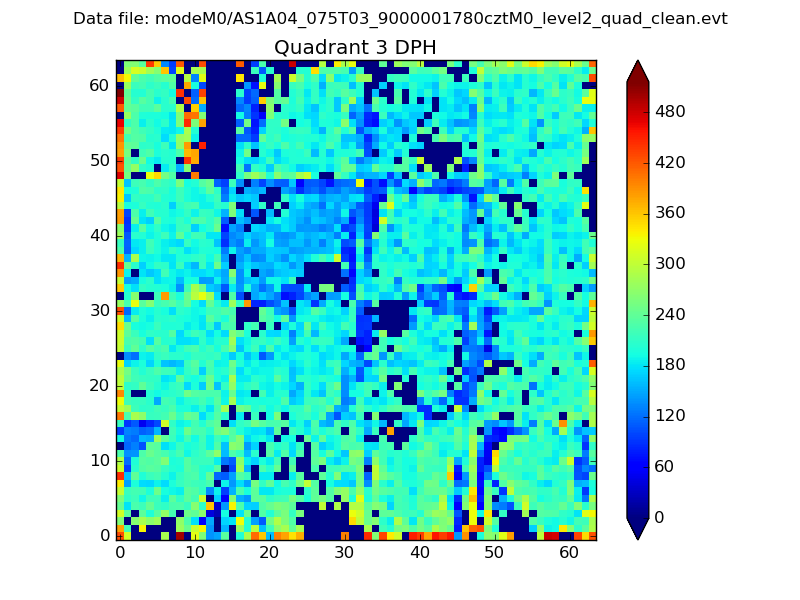 |
 |
Quadrant C |
| Plot type | Count rate plots | Images |
|---|---|---|
| Comparison with Poisson distribution Blue bars denote a histogram of data divided into 1 sec bins. Red curve is a Poisson curve with rate = median count rate of data. |
 |
 |
| Quadrant-wise count rates Data is divided into 100 sec bins |
 |
|
| Module-wise count rates for Quadrant A Data is divided into 100 sec bins |
 |
 |
| Module-wise count rates for Quadrant B Data is divided into 100 sec bins |
 |
 |
| Module-wise count rates for Quadrant C Data is divided into 100 sec bins |
 |
 |
| Module-wise count rates for Quadrant D Data is divided into 100 sec bins |
 |
 |
| Parameter | Plot |
|---|---|
| CZT HV Monitor |  |
| D_VDD |  |
| Temperature 1 |  |
| Veto HV Monitor |  |
| Veto LLD |  |
| Alpha Counter |  |
| _CPM_Rate |  |
| CZT Counter | 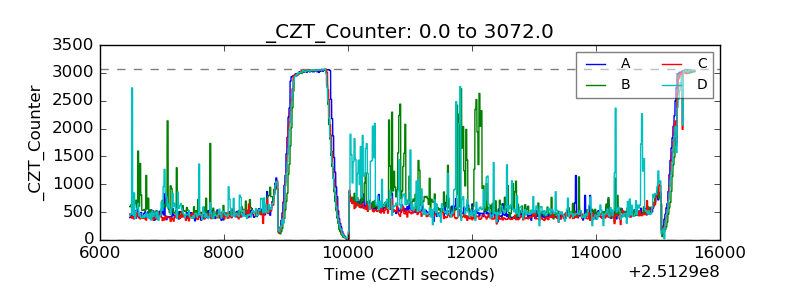 |
| +2.5 Volts monitor |  |
| +5 Volts monitor |  |
| _ROLL_ROT |  |
| _Roll_DEC |  |
| _Roll_RA |  |
| Veto Counter |  |