| Param | Original file | Final file |
|---|---|---|
| Filename | modeM0/AS1A04_044T01_9000001782cztM0_level2.evt | modeM0/AS1A04_044T01_9000001782cztM0_level2_quad_clean.evt |
| Size (bytes) | 4,941,115,200 | 782,968,320 |
| Size | 4.6 GB | 746.7 MB |
| Events in quadrant A | 35,097,067 | 4,912,928 |
| Events in quadrant B | 33,193,439 | 5,028,512 |
| Events in quadrant C | 29,210,864 | 4,891,131 |
| Events in quadrant D | 47,850,458 | 4,515,954 |
| Mode SS | |||
|---|---|---|---|
| Quadrant | BADHDUFLAG | Total packets | Discarded packets |
| A | 0 | 1292 | 0 |
| B | 0 | 1292 | 0 |
| C | 0 | 1292 | 0 |
| D | 0 | 1292 | 0 |
| Mode M9 | |||
|---|---|---|---|
| Quadrant | BADHDUFLAG | Total packets | Discarded packets |
| A | 0 | 87 | 0 |
| B | 0 | 87 | 0 |
| C | 0 | 87 | 0 |
| D | 0 | 87 | 0 |
| Mode M0 | |||
|---|---|---|---|
| Quadrant | BADHDUFLAG | Total packets | Discarded packets |
| A | 0 | 146049 | 0 |
| B | 0 | 139992 | 0 |
| C | 0 | 131050 | 0 |
| D | 0 | 184746 | 0 |
| Quadrant | Total seconds | Saturated seconds | Saturation percentage |
|---|---|---|---|
| A | 63653 | 2193 | 3.445242% |
| B | 63653 | 1234 | 1.938636% |
| C | 63653 | 461 | 0.724239% |
| D | 63653 | 5596 | 8.791416% |
Noise dominated data is calculated using 1-second bins in cleaned event files. If a bin has >2000 counts, and if more than 50% of those come from <1% of pixels, then it is considered to be noise-dominated and hence unusable.
| Quadrant | # 1 sec bins | Bins with >0 counts | Bins with >2000 counts | High rate bins dominated by noise | Noise dominated (total time) | Noise dominated (detector-on time) | Marked lightcurve |
|---|---|---|---|---|---|---|---|
| A | 72249 | 63657 | 1265 | 1265 | 1.75% | 1.99% |  |
| B | 72249 | 63658 | 249 | 249 | 0.34% | 0.39% |  |
| C | 72249 | 63660 | 25 | 25 | 0.03% | 0.04% |  |
| D | 72248 | 63659 | 5040 | 5040 | 6.98% | 7.92% |  |
Top three noisy pixels from each quadrant. If the there are fewer than three noisy pixels in the level2.evt file, extra rows are filled as -1
| Pixel properties | Quadrant properties | ||||||
|---|---|---|---|---|---|---|---|
| Quadrant | DetID | PixID | Counts | Sigma | Mean | Median | Sigma |
| A | 5 | 16 | 3255428 | 2153.82 | 7542 | 7389 | 1508.0 |
| A | 1 | 162 | 708831 | 465.14 | 7542 | 7389 | 1508.0 |
| A | 13 | 248 | 628212 | 411.68 | 7542 | 7389 | 1508.0 |
| B | 4 | 239 | 2226238 | 1536.2 | 7645 | 7462 | 1444.3 |
| B | 15 | 204 | 540471 | 369.04 | 7645 | 7462 | 1444.3 |
| B | 0 | 85 | 348499 | 236.12 | 7645 | 7462 | 1444.3 |
| C | 14 | 234 | 196198 | 109.75 | 7439 | 7487 | 1719.5 |
| C | 13 | 61 | 54165 | 27.15 | 7439 | 7487 | 1719.5 |
| C | 8 | 128 | 19206 | 6.82 | 7439 | 7487 | 1719.5 |
| D | 1 | 52 | 16542174 | 9842.91 | 7058 | 6871 | 1679.9 |
| D | 8 | 195 | 1638214 | 971.08 | 7058 | 6871 | 1679.9 |
| D | 13 | 104 | 771826 | 455.35 | 7058 | 6871 | 1679.9 |
Histogram calculated using DETX and DETY for each event in the final _common_clean file
| Quadrant A |  |
 |
Quadrant B |
|---|---|---|---|
| Quadrant D |  |
 |
Quadrant C |
| Plot type | Count rate plots | Images |
|---|---|---|
| Comparison with Poisson distribution Blue bars denote a histogram of data divided into 1 sec bins. Red curve is a Poisson curve with rate = median count rate of data. |
 |
 |
| Quadrant-wise count rates Data is divided into 100 sec bins |
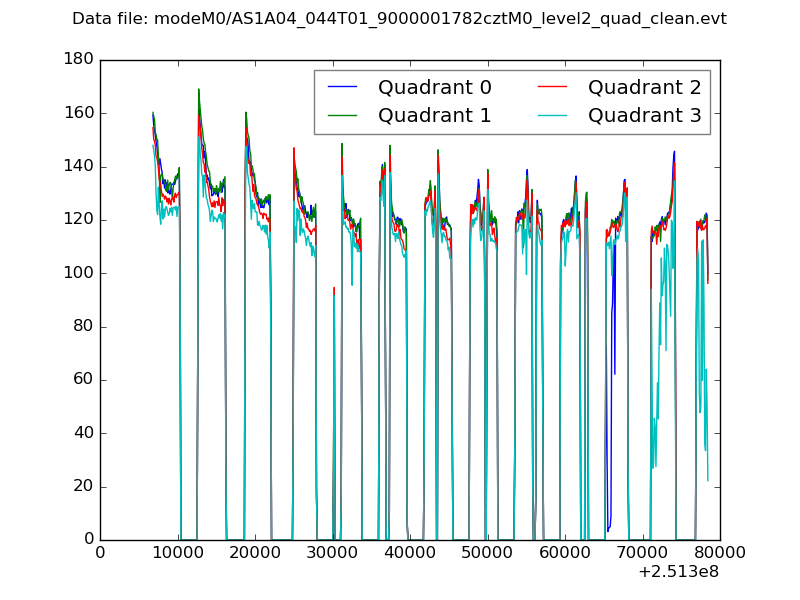 |
|
| Module-wise count rates for Quadrant A Data is divided into 100 sec bins |
 |
 |
| Module-wise count rates for Quadrant B Data is divided into 100 sec bins |
 |
 |
| Module-wise count rates for Quadrant C Data is divided into 100 sec bins |
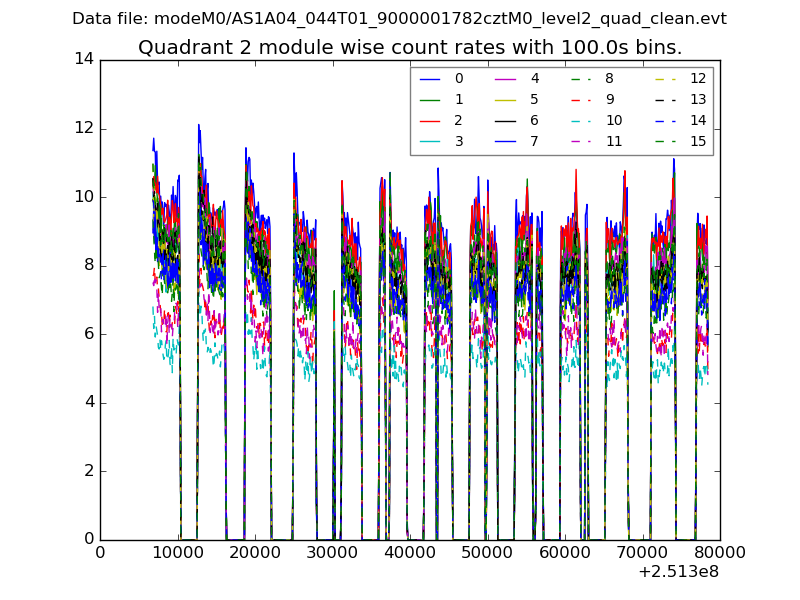 |
 |
| Module-wise count rates for Quadrant D Data is divided into 100 sec bins |
 |
 |
| Parameter | Plot |
|---|---|
| CZT HV Monitor |  |
| D_VDD |  |
| Temperature 1 |  |
| Veto HV Monitor |  |
| Veto LLD |  |
| Alpha Counter |  |
| _CPM_Rate |  |
| CZT Counter |  |
| +2.5 Volts monitor |  |
| +5 Volts monitor |  |
| _ROLL_ROT |  |
| _Roll_DEC |  |
| _Roll_RA | 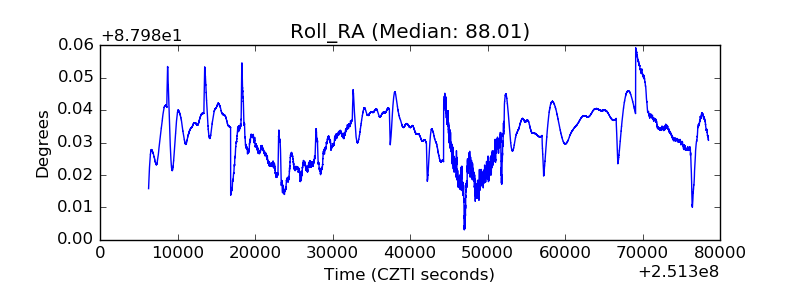 |
| Veto Counter |  |