| Param | Original file | Final file |
|---|---|---|
| Filename | modeM0/AS1G08_024T01_9000001776cztM0_level2_bc.evt | modeM0/AS1G08_024T01_9000001776cztM0_level2_quad_clean.evt |
| Size (bytes) | 1,574,426,880 | 474,056,640 |
| Size | 1.5 GB | 452.1 MB |
| Events in quadrant A | 8,005,245 | 3,103,039 |
| Events in quadrant B | 11,841,969 | 3,032,266 |
| Events in quadrant C | 6,930,608 | 3,064,304 |
| Events in quadrant D | 18,644,049 | 2,881,763 |
| Mode SS | |||
|---|---|---|---|
| Quadrant | BADHDUFLAG | Total packets | Discarded packets |
| A | 0 | 676 | 0 |
| B | 0 | 676 | 0 |
| C | 0 | 676 | 0 |
| D | 0 | 676 | 0 |
| Mode M0 | |||
|---|---|---|---|
| Quadrant | BADHDUFLAG | Total packets | Discarded packets |
| A | 0 | 75674 | 0 |
| B | 0 | 88496 | 0 |
| C | 0 | 69062 | 0 |
| D | 0 | 106542 | 0 |
| Mode M9 | |||
|---|---|---|---|
| Quadrant | BADHDUFLAG | Total packets | Discarded packets |
| A | 0 | 71 | 0 |
| B | 0 | 71 | 0 |
| C | 0 | 71 | 0 |
| D | 0 | 71 | 0 |
| Quadrant | Total seconds | Saturated seconds | Saturation percentage |
|---|---|---|---|
| A | 33140 | 778 | 2.347616% |
| B | 33140 | 2127 | 6.418226% |
| C | 33140 | 386 | 1.164756% |
| D | 33140 | 3728 | 11.249246% |
Noise dominated data is calculated using 1-second bins in cleaned event files. If a bin has >2000 counts, and if more than 50% of those come from <1% of pixels, then it is considered to be noise-dominated and hence unusable.
| Quadrant | # 1 sec bins | Bins with >0 counts | Bins with >2000 counts | High rate bins dominated by noise | Noise dominated (total time) | Noise dominated (detector-on time) | Marked lightcurve |
|---|---|---|---|---|---|---|---|
| A | 40201 | 33134 | 6 | 6 | 0.01% | 0.02% | 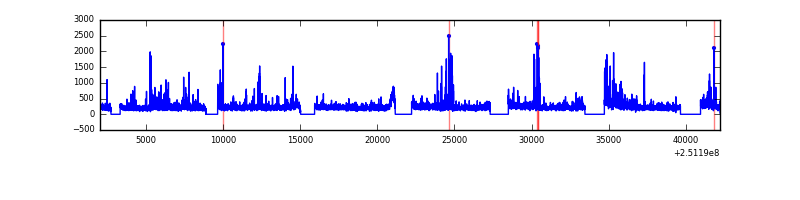 |
| B | 40201 | 33131 | 74 | 74 | 0.18% | 0.22% |  |
| C | 40201 | 33134 | 0 | 0 | 0.00% | 0.00% |  |
| D | 40201 | 33134 | 1468 | 1468 | 3.65% | 4.43% |  |
Top three noisy pixels from each quadrant. If the there are fewer than three noisy pixels in the level2.evt file, extra rows are filled as -1
| Pixel properties | Quadrant properties | ||||||
|---|---|---|---|---|---|---|---|
| Quadrant | DetID | PixID | Counts | Sigma | Mean | Median | Sigma |
| A | 1 | 162 | 343824 | 876.81 | 1781 | 1754 | 390.1 |
| A | 13 | 248 | 330491 | 842.63 | 1781 | 1754 | 390.1 |
| A | 4 | 2 | 241572 | 614.71 | 1781 | 1754 | 390.1 |
| B | 4 | 239 | 2211003 | 6656.05 | 1730 | 1685 | 331.9 |
| B | 4 | 206 | 1083203 | 3258.31 | 1730 | 1685 | 331.9 |
| B | 10 | 245 | 724384 | 2177.29 | 1730 | 1685 | 331.9 |
| C | 13 | 250 | 87778 | 221.29 | 1732 | 1709 | 388.9 |
| C | 7 | 247 | 54354 | 135.35 | 1732 | 1709 | 388.9 |
| C | 14 | 234 | 13655 | 30.71 | 1732 | 1709 | 388.9 |
| D | 1 | 52 | 8434675 | 20768.27 | 1699 | 1639 | 406.1 |
| D | 4 | 95 | 1115513 | 2743.17 | 1699 | 1639 | 406.1 |
| D | 8 | 195 | 703376 | 1728.19 | 1699 | 1639 | 406.1 |
Histogram calculated using DETX and DETY for each event in the final _common_clean file
| Quadrant A |  |
 |
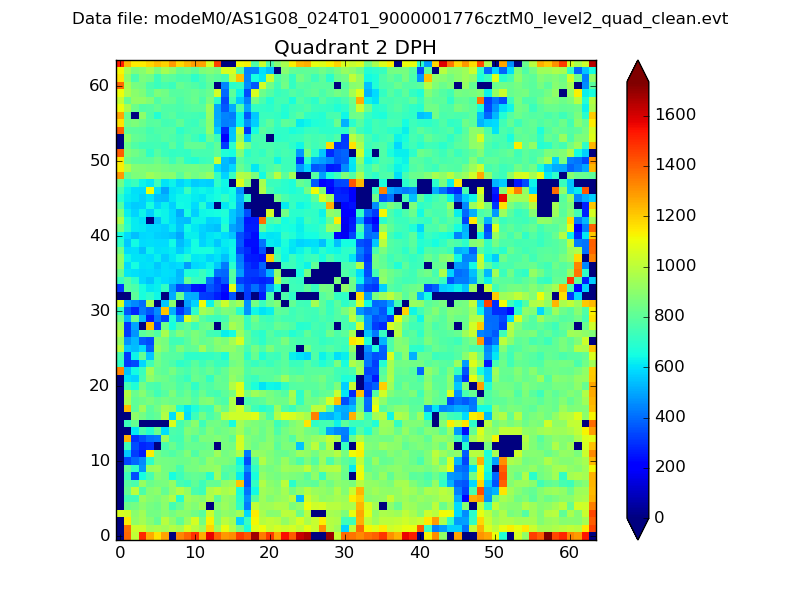
Quadrant B |
|---|---|---|---|
| Quadrant D |  |
 |
Quadrant C |
| Plot type | Count rate plots | Images |
|---|---|---|
| Comparison with Poisson distribution Blue bars denote a histogram of data divided into 1 sec bins. Red curve is a Poisson curve with rate = median count rate of data. |
 |
 |
| Quadrant-wise count rates Data is divided into 100 sec bins |
 |
|
| Module-wise count rates for Quadrant A Data is divided into 100 sec bins |
 |
 |
| Module-wise count rates for Quadrant B Data is divided into 100 sec bins |
 |
 |
| Module-wise count rates for Quadrant C Data is divided into 100 sec bins |
 |
 |
| Module-wise count rates for Quadrant D Data is divided into 100 sec bins |
 |
 |
| Parameter | Plot |
|---|---|
| CZT HV Monitor |  |
| D_VDD |  |
| Temperature 1 |  |
| Veto HV Monitor | 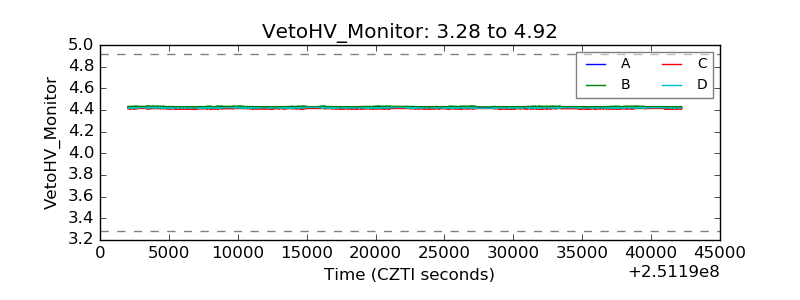 |
| Veto LLD |  |
| Alpha Counter |  |
| _CPM_Rate | 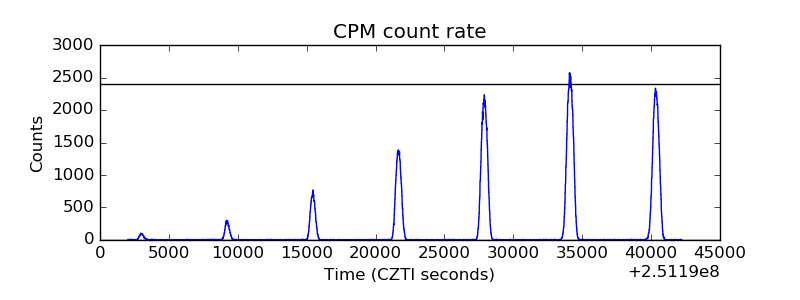 |
| CZT Counter | 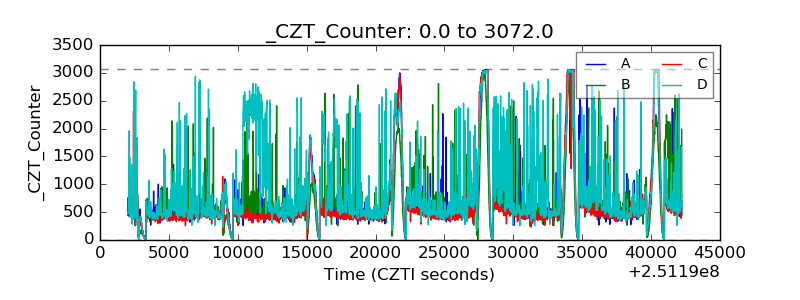 |
| +2.5 Volts monitor | 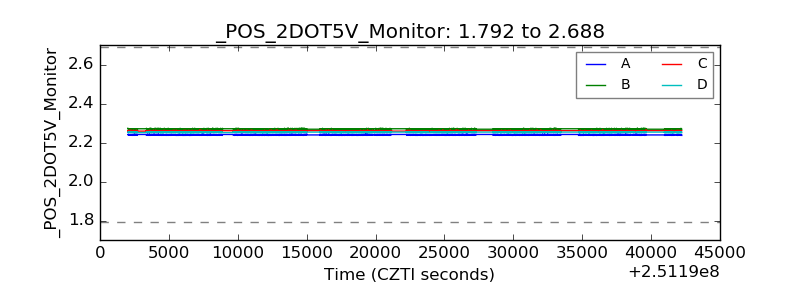 |
| +5 Volts monitor | 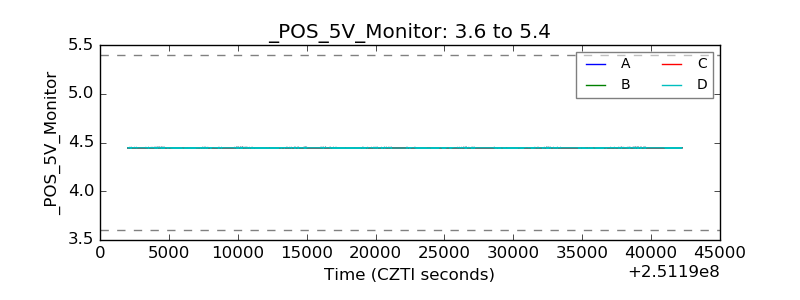 |
| _ROLL_ROT | 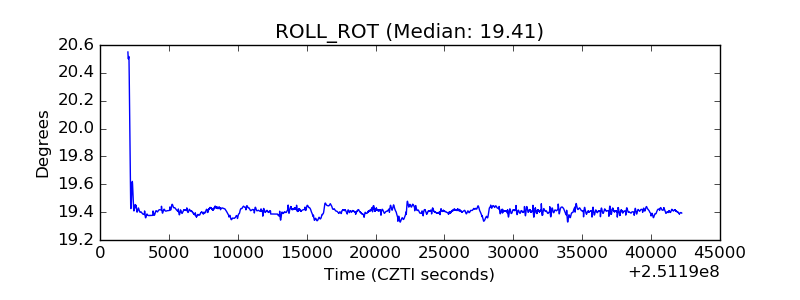 |
| _Roll_DEC |  |
| _Roll_RA |  |
| Veto Counter | 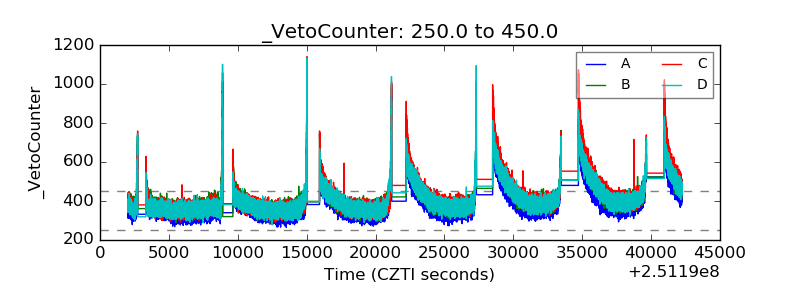 |