| Param | Original file | Final file |
|---|---|---|
| Filename | modeM0/AS1A04_112T01_9000001778cztM0_level2_bc.evt | modeM0/AS1A04_112T01_9000001778cztM0_level2_quad_clean.evt |
| Size (bytes) | 2,518,228,800 | 919,350,720 |
| Size | 2.3 GB | 876.8 MB |
| Events in quadrant A | 12,307,929 | 6,152,722 |
| Events in quadrant B | 28,901,247 | 5,954,165 |
| Events in quadrant C | 10,432,611 | 6,186,779 |
| Events in quadrant D | 20,868,888 | 5,770,300 |
| Mode M9 | |||
|---|---|---|---|
| Quadrant | BADHDUFLAG | Total packets | Discarded packets |
| A | 0 | 72 | 0 |
| B | 0 | 72 | 0 |
| C | 0 | 72 | 0 |
| D | 0 | 72 | 0 |
| Mode M0 | |||
|---|---|---|---|
| Quadrant | BADHDUFLAG | Total packets | Discarded packets |
| A | 0 | 121956 | 0 |
| B | 0 | 176868 | 0 |
| C | 0 | 112430 | 0 |
| D | 0 | 146941 | 0 |
| Mode SS | |||
|---|---|---|---|
| Quadrant | BADHDUFLAG | Total packets | Discarded packets |
| A | 0 | 1122 | 0 |
| B | 0 | 1122 | 0 |
| C | 0 | 1122 | 0 |
| D | 0 | 1122 | 0 |
| Quadrant | Total seconds | Saturated seconds | Saturation percentage |
|---|---|---|---|
| A | 55122 | 1166 | 2.115308% |
| B | 55122 | 5720 | 10.376982% |
| C | 55122 | 469 | 0.850840% |
| D | 55122 | 3038 | 5.511411% |
Noise dominated data is calculated using 1-second bins in cleaned event files. If a bin has >2000 counts, and if more than 50% of those come from <1% of pixels, then it is considered to be noise-dominated and hence unusable.
| Quadrant | # 1 sec bins | Bins with >0 counts | Bins with >2000 counts | High rate bins dominated by noise | Noise dominated (total time) | Noise dominated (detector-on time) | Marked lightcurve |
|---|---|---|---|---|---|---|---|
| A | 62318 | 55118 | 45 | 45 | 0.07% | 0.08% | 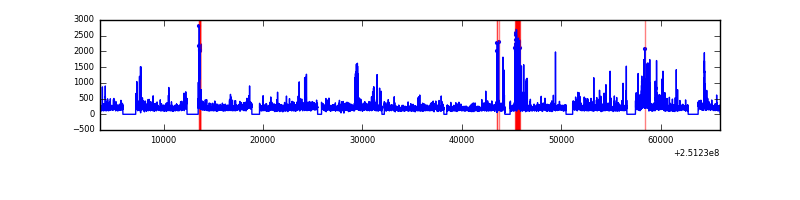 |
| B | 62318 | 55115 | 368 | 368 | 0.59% | 0.67% |  |
| C | 62318 | 55117 | 1 | 1 | 0.00% | 0.00% |  |
| D | 62318 | 55117 | 611 | 611 | 0.98% | 1.11% |  |
Top three noisy pixels from each quadrant. If the there are fewer than three noisy pixels in the level2.evt file, extra rows are filled as -1
| Pixel properties | Quadrant properties | ||||||
|---|---|---|---|---|---|---|---|
| Quadrant | DetID | PixID | Counts | Sigma | Mean | Median | Sigma |
| A | 13 | 248 | 763363 | 1298.99 | 2672 | 2622 | 585.6 |
| A | 14 | 63 | 454127 | 770.96 | 2672 | 2622 | 585.6 |
| A | 1 | 162 | 435364 | 738.92 | 2672 | 2622 | 585.6 |
| B | 4 | 206 | 10969990 | 21650.67 | 2619 | 2547 | 506.6 |
| B | 4 | 239 | 3028947 | 5974.37 | 2619 | 2547 | 506.6 |
| B | 3 | 64 | 2788063 | 5498.84 | 2619 | 2547 | 506.6 |
| C | 14 | 234 | 43130 | 68.57 | 2649 | 2609 | 591.0 |
| C | 0 | 207 | 17344 | 24.93 | 2649 | 2609 | 591.0 |
| C | 13 | 61 | 16097 | 22.82 | 2649 | 2609 | 591.0 |
| D | 1 | 52 | 4234627 | 6875.65 | 2598 | 2500 | 615.5 |
| D | 7 | 80 | 2392767 | 3883.3 | 2598 | 2500 | 615.5 |
| D | 8 | 195 | 1497593 | 2428.97 | 2598 | 2500 | 615.5 |
Histogram calculated using DETX and DETY for each event in the final _common_clean file
| Quadrant A |  |
 |
Quadrant B |
|---|---|---|---|
| Quadrant D | 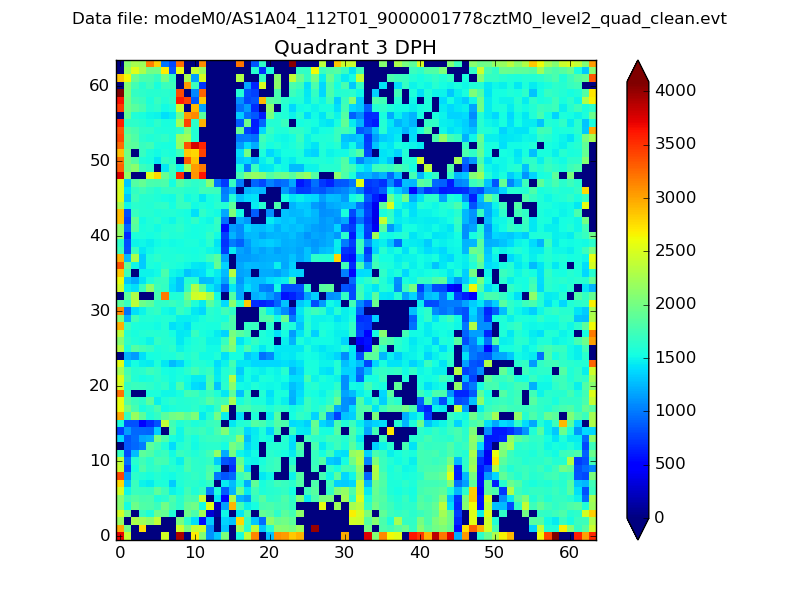 |
 |
Quadrant C |
| Plot type | Count rate plots | Images |
|---|---|---|
| Comparison with Poisson distribution Blue bars denote a histogram of data divided into 1 sec bins. Red curve is a Poisson curve with rate = median count rate of data. |
 |
 |
| Quadrant-wise count rates Data is divided into 100 sec bins |
 |
|
| Module-wise count rates for Quadrant A Data is divided into 100 sec bins |
 |
 |
| Module-wise count rates for Quadrant B Data is divided into 100 sec bins |
 |
 |
| Module-wise count rates for Quadrant C Data is divided into 100 sec bins |
 |
 |
| Module-wise count rates for Quadrant D Data is divided into 100 sec bins |
 |
 |
| Parameter | Plot |
|---|---|
| CZT HV Monitor | 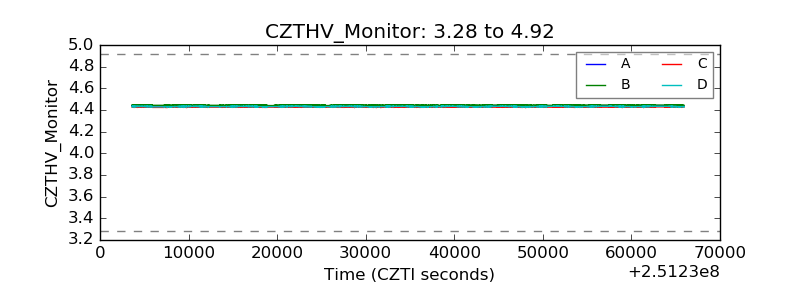 |
| D_VDD |  |
| Temperature 1 |  |
| Veto HV Monitor |  |
| Veto LLD | 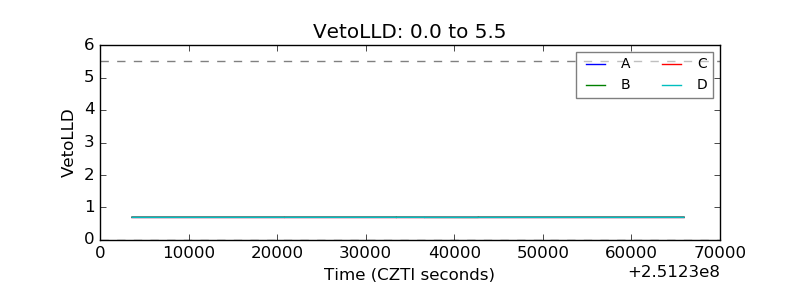 |
| Alpha Counter | 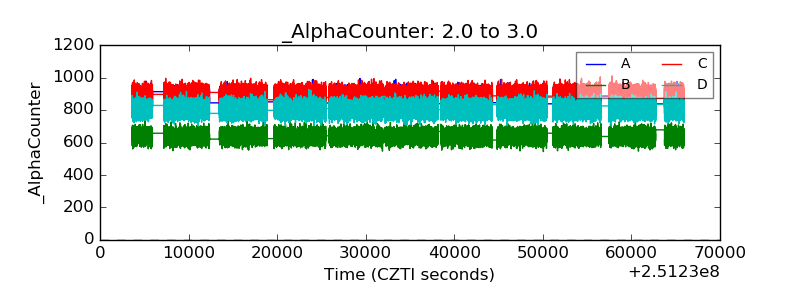 |
| _CPM_Rate |  |
| CZT Counter |  |
| +2.5 Volts monitor | 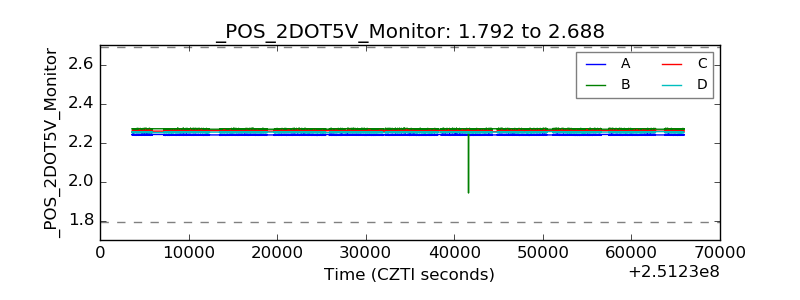 |
| +5 Volts monitor |  |
| _ROLL_ROT |  |
| _Roll_DEC |  |
| _Roll_RA |  |
| Veto Counter |  |