| Param | Original file | Final file |
|---|---|---|
| Filename | modeM0/AS1G08_076T03_9000001768cztM0_level2_bc.evt | modeM0/AS1G08_076T03_9000001768cztM0_level2_quad_clean.evt |
| Size (bytes) | 696,980,160 | 245,416,320 |
| Size | 664.7 MB | 234.0 MB |
| Events in quadrant A | 3,936,088 | 1,592,957 |
| Events in quadrant B | 5,967,254 | 1,554,060 |
| Events in quadrant C | 3,400,930 | 1,596,293 |
| Events in quadrant D | 6,635,561 | 1,513,537 |
| Mode M9 | |||
|---|---|---|---|
| Quadrant | BADHDUFLAG | Total packets | Discarded packets |
| A | 0 | 40 | 0 |
| B | 0 | 40 | 0 |
| C | 0 | 40 | 0 |
| D | 0 | 40 | 0 |
| Mode SS | |||
|---|---|---|---|
| Quadrant | BADHDUFLAG | Total packets | Discarded packets |
| A | 0 | 348 | 0 |
| B | 0 | 348 | 0 |
| C | 0 | 348 | 0 |
| D | 0 | 348 | 0 |
| Mode M0 | |||
|---|---|---|---|
| Quadrant | BADHDUFLAG | Total packets | Discarded packets |
| A | 0 | 38472 | 0 |
| B | 0 | 45570 | 0 |
| C | 0 | 34947 | 0 |
| D | 0 | 44899 | 0 |
| Quadrant | Total seconds | Saturated seconds | Saturation percentage |
|---|---|---|---|
| A | 17060 | 323 | 1.893318% |
| B | 17060 | 856 | 5.017585% |
| C | 17060 | 107 | 0.627198% |
| D | 17060 | 625 | 3.663540% |
Noise dominated data is calculated using 1-second bins in cleaned event files. If a bin has >2000 counts, and if more than 50% of those come from <1% of pixels, then it is considered to be noise-dominated and hence unusable.
| Quadrant | # 1 sec bins | Bins with >0 counts | Bins with >2000 counts | High rate bins dominated by noise | Noise dominated (total time) | Noise dominated (detector-on time) | Marked lightcurve |
|---|---|---|---|---|---|---|---|
| A | 20321 | 17056 | 37 | 37 | 0.18% | 0.22% |  |
| B | 20322 | 17059 | 33 | 33 | 0.16% | 0.19% |  |
| C | 20321 | 17059 | 0 | 0 | 0.00% | 0.00% | 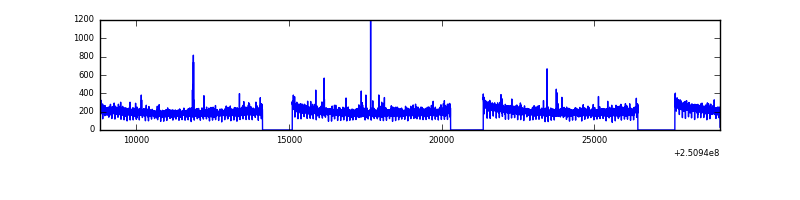 |
| D | 20321 | 17057 | 172 | 172 | 0.85% | 1.01% |  |
Top three noisy pixels from each quadrant. If the there are fewer than three noisy pixels in the level2.evt file, extra rows are filled as -1
| Pixel properties | Quadrant properties | ||||||
|---|---|---|---|---|---|---|---|
| Quadrant | DetID | PixID | Counts | Sigma | Mean | Median | Sigma |
| A | 1 | 162 | 190175 | 988.28 | 880 | 862 | 191.6 |
| A | 6 | 254 | 133046 | 690.04 | 880 | 862 | 191.6 |
| A | 11 | 29 | 98408 | 509.22 | 880 | 862 | 191.6 |
| B | 4 | 239 | 1634326 | 9861.62 | 866 | 845 | 165.6 |
| B | 15 | 204 | 305247 | 1837.73 | 866 | 845 | 165.6 |
| B | 3 | 64 | 186366 | 1120.02 | 866 | 845 | 165.6 |
| C | 14 | 234 | 9590 | 45.24 | 865 | 853 | 193.1 |
| C | 0 | 207 | 8424 | 39.2 | 865 | 853 | 193.1 |
| C | 13 | 61 | 5272 | 22.88 | 865 | 853 | 193.1 |
| D | 1 | 52 | 1165275 | 5734.29 | 870 | 838 | 203.1 |
| D | 8 | 195 | 694668 | 3416.78 | 870 | 838 | 203.1 |
| D | 10 | 15 | 545155 | 2680.5 | 870 | 838 | 203.1 |
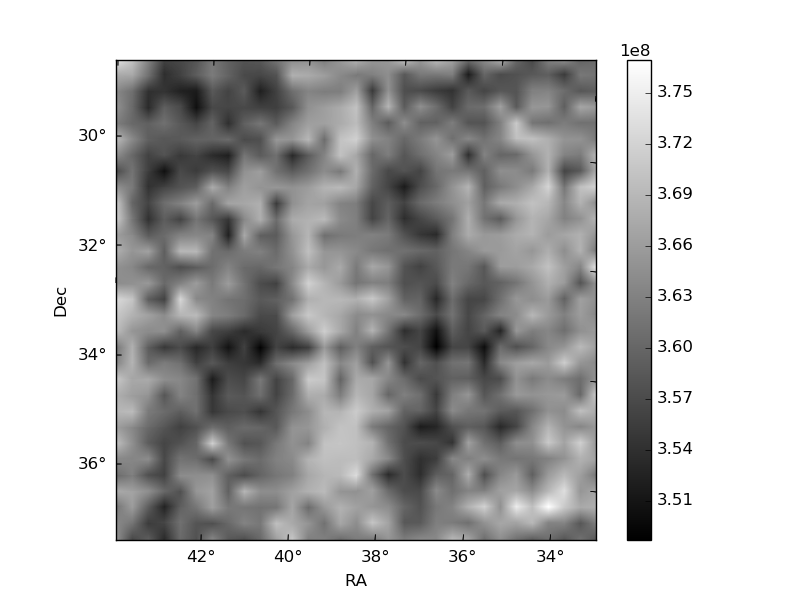
Histogram calculated using DETX and DETY for each event in the final _common_clean file
| Quadrant A |  |
 |
Quadrant B |
|---|---|---|---|
| Quadrant D |  |
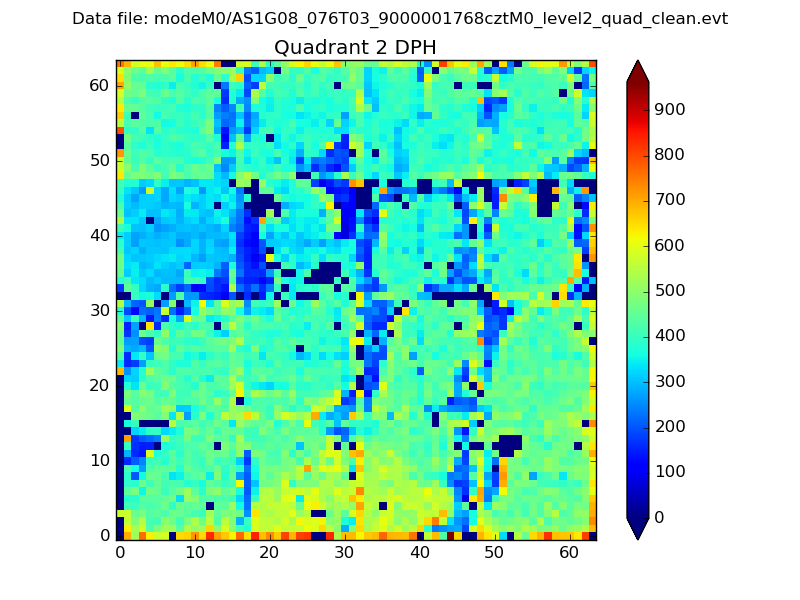 |
Quadrant C |
| Plot type | Count rate plots | Images |
|---|---|---|
| Comparison with Poisson distribution Blue bars denote a histogram of data divided into 1 sec bins. Red curve is a Poisson curve with rate = median count rate of data. |
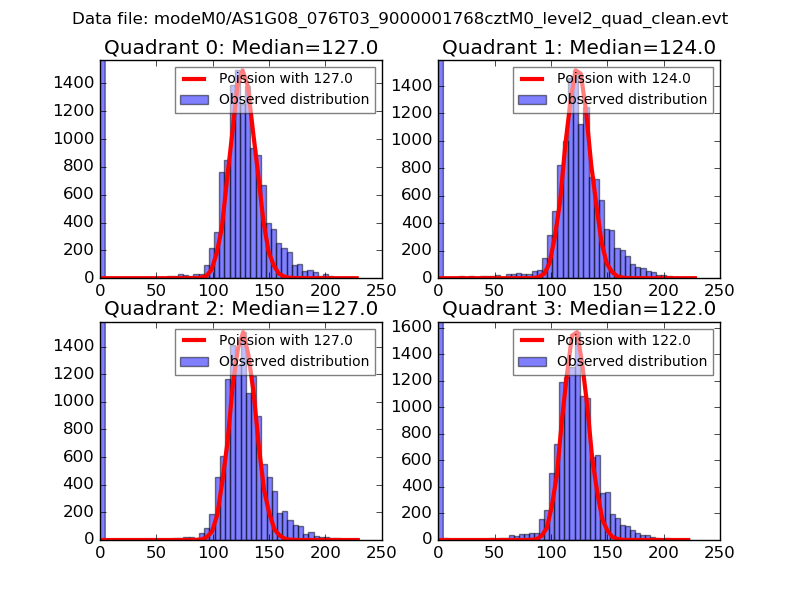 |
 |
| Quadrant-wise count rates Data is divided into 100 sec bins |
 |
|
| Module-wise count rates for Quadrant A Data is divided into 100 sec bins |
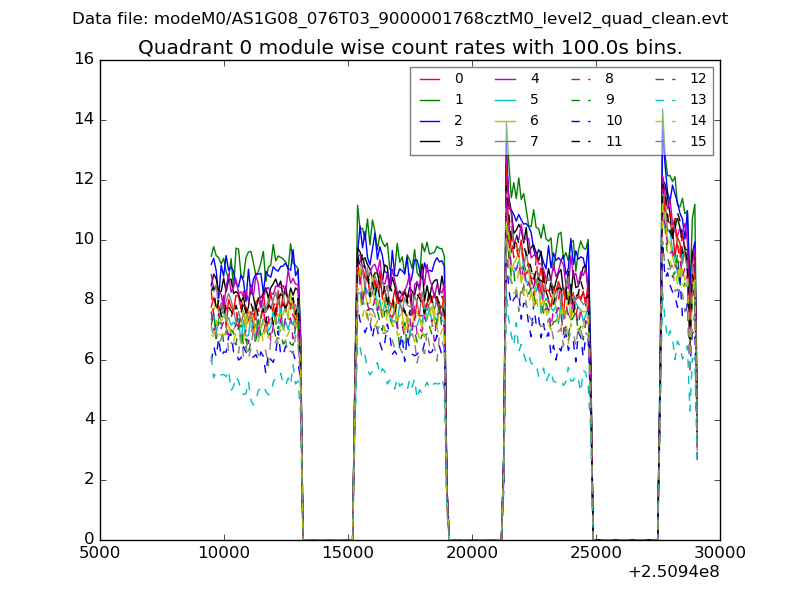 |
 |
| Module-wise count rates for Quadrant B Data is divided into 100 sec bins |
 |
 |
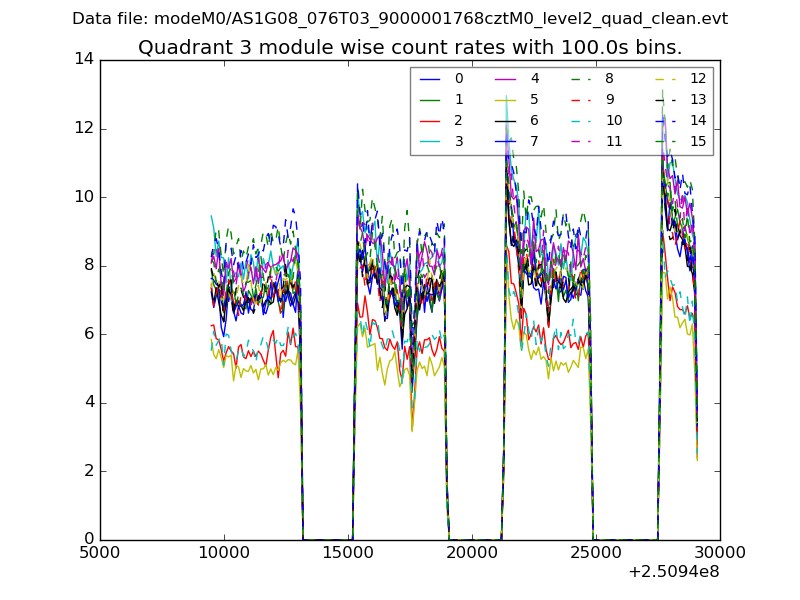
| Module-wise count rates for Quadrant C Data is divided into 100 sec bins |
 |
 |
| Module-wise count rates for Quadrant D Data is divided into 100 sec bins |
 |
 |
| Parameter | Plot |
|---|---|
| CZT HV Monitor |  |
| D_VDD |  |
| Temperature 1 |  |
| Veto HV Monitor |  |
| Veto LLD |  |
| Alpha Counter |  |
| _CPM_Rate |  |
| CZT Counter | 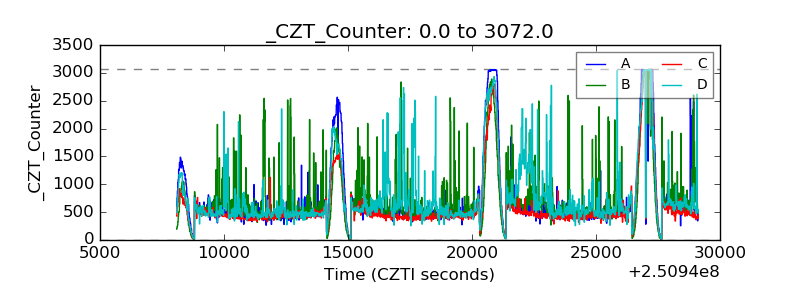 |
| +2.5 Volts monitor | 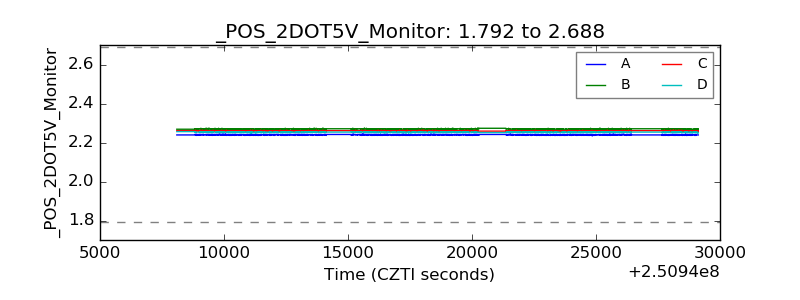 |
| +5 Volts monitor |  |
| _ROLL_ROT |  |
| _Roll_DEC | 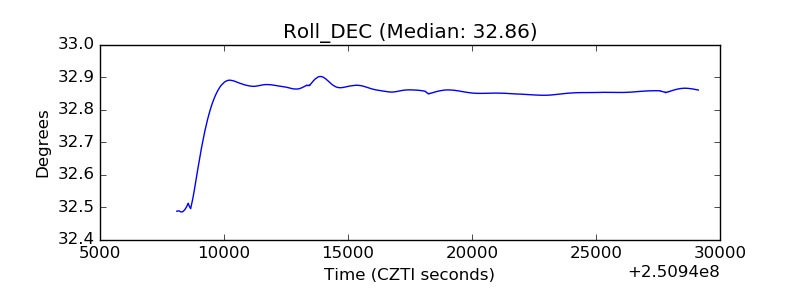 |
| _Roll_RA | 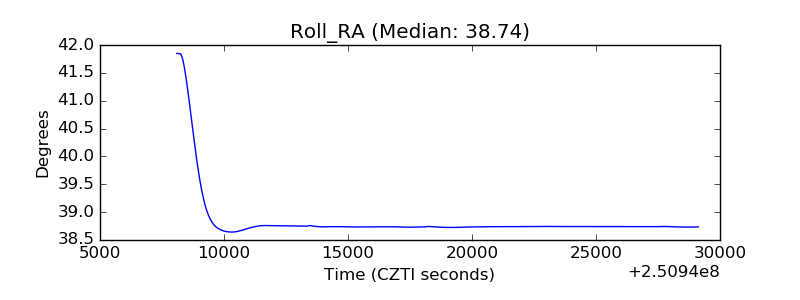 |
| Veto Counter |  |