| Param | Original file | Final file |
|---|---|---|
| Filename | modeM0/AS1A04_164T01_9000001770cztM0_level2_bc.evt | modeM0/AS1A04_164T01_9000001770cztM0_level2_quad_clean.evt |
| Size (bytes) | 677,511,360 | 206,510,400 |
| Size | 646.1 MB | 196.9 MB |
| Events in quadrant A | 3,931,571 | 1,283,985 |
| Events in quadrant B | 5,589,895 | 1,282,563 |
| Events in quadrant C | 3,549,505 | 1,272,174 |
| Events in quadrant D | 6,234,874 | 1,195,013 |
| Mode SS | |||
|---|---|---|---|
| Quadrant | BADHDUFLAG | Total packets | Discarded packets |
| A | 0 | 364 | 0 |
| B | 0 | 364 | 0 |
| C | 0 | 364 | 0 |
| D | 0 | 364 | 0 |
| Mode M9 | |||
|---|---|---|---|
| Quadrant | BADHDUFLAG | Total packets | Discarded packets |
| A | 0 | 38 | 0 |
| B | 0 | 38 | 0 |
| C | 0 | 38 | 0 |
| D | 0 | 38 | 0 |
| Mode M0 | |||
|---|---|---|---|
| Quadrant | BADHDUFLAG | Total packets | Discarded packets |
| A | 0 | 38634 | 0 |
| B | 0 | 44844 | 0 |
| C | 0 | 36291 | 0 |
| D | 0 | 44596 | 0 |
| Quadrant | Total seconds | Saturated seconds | Saturation percentage |
|---|---|---|---|
| A | 17701 | 202 | 1.141178% |
| B | 17701 | 755 | 4.265296% |
| C | 17701 | 62 | 0.350263% |
| D | 17701 | 434 | 2.451839% |
Noise dominated data is calculated using 1-second bins in cleaned event files. If a bin has >2000 counts, and if more than 50% of those come from <1% of pixels, then it is considered to be noise-dominated and hence unusable.
| Quadrant | # 1 sec bins | Bins with >0 counts | Bins with >2000 counts | High rate bins dominated by noise | Noise dominated (total time) | Noise dominated (detector-on time) | Marked lightcurve |
|---|---|---|---|---|---|---|---|
| A | 21522 | 17701 | 3 | 3 | 0.01% | 0.02% |  |
| B | 21522 | 17700 | 8 | 8 | 0.04% | 0.05% |  |
| C | 21522 | 17702 | 0 | 0 | 0.00% | 0.00% |  |
| D | 21522 | 17702 | 71 | 71 | 0.33% | 0.40% |  |
Top three noisy pixels from each quadrant. If the there are fewer than three noisy pixels in the level2.evt file, extra rows are filled as -1
| Pixel properties | Quadrant properties | ||||||
|---|---|---|---|---|---|---|---|
| Quadrant | DetID | PixID | Counts | Sigma | Mean | Median | Sigma |
| A | 1 | 162 | 133222 | 658.08 | 923 | 905 | 201.1 |
| A | 11 | 29 | 127893 | 631.58 | 923 | 905 | 201.1 |
| A | 8 | 15 | 24583 | 117.76 | 923 | 905 | 201.1 |
| B | 4 | 239 | 1496523 | 8606.49 | 927 | 904 | 173.8 |
| B | 15 | 204 | 173983 | 995.98 | 927 | 904 | 173.8 |
| B | 11 | 51 | 120314 | 687.14 | 927 | 904 | 173.8 |
| C | 13 | 61 | 5395 | 22.63 | 906 | 894 | 198.9 |
| C | 14 | 234 | 4300 | 17.13 | 906 | 894 | 198.9 |
| C | 0 | 207 | 3891 | 15.07 | 906 | 894 | 198.9 |
| D | 1 | 52 | 894622 | 4352.49 | 892 | 859 | 205.3 |
| D | 4 | 95 | 570255 | 2772.87 | 892 | 859 | 205.3 |
| D | 8 | 195 | 523044 | 2542.96 | 892 | 859 | 205.3 |
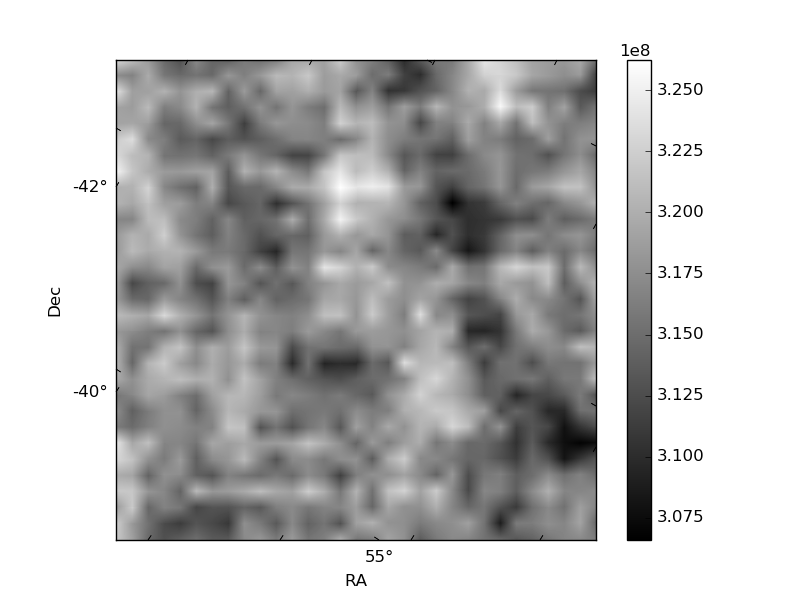
Histogram calculated using DETX and DETY for each event in the final _common_clean file
| Quadrant A |  |
 |
Quadrant B |
|---|---|---|---|
| Quadrant D |  |
 |
Quadrant C |
| Plot type | Count rate plots | Images |
|---|---|---|
| Comparison with Poisson distribution Blue bars denote a histogram of data divided into 1 sec bins. Red curve is a Poisson curve with rate = median count rate of data. |
 |
 |
| Quadrant-wise count rates Data is divided into 100 sec bins |
 |
|
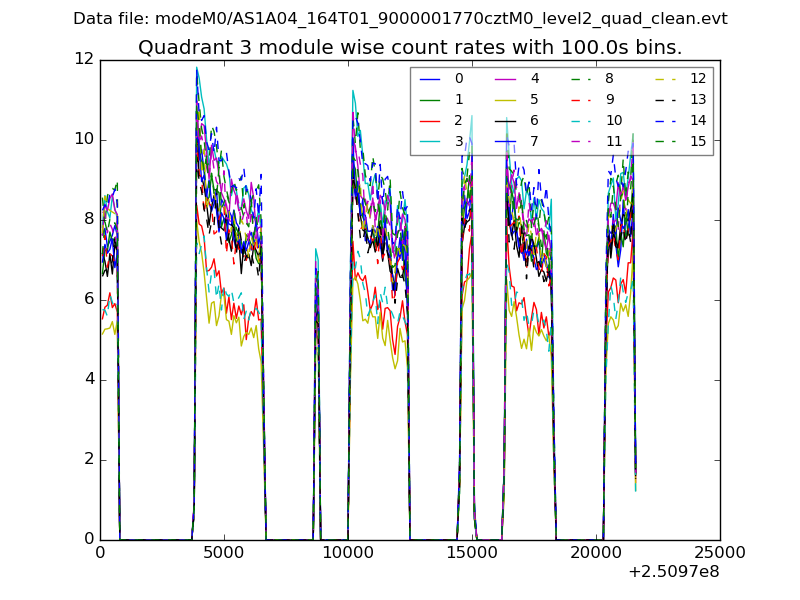
| Module-wise count rates for Quadrant A Data is divided into 100 sec bins |
 |
 |
| Module-wise count rates for Quadrant B Data is divided into 100 sec bins |
 |
 |
| Module-wise count rates for Quadrant C Data is divided into 100 sec bins |
 |
 |
| Module-wise count rates for Quadrant D Data is divided into 100 sec bins |
 |
 |
| Parameter | Plot |
|---|---|
| CZT HV Monitor |  |
| D_VDD |  |
| Temperature 1 |  |
| Veto HV Monitor |  |
| Veto LLD |  |
| Alpha Counter |  |
| _CPM_Rate | 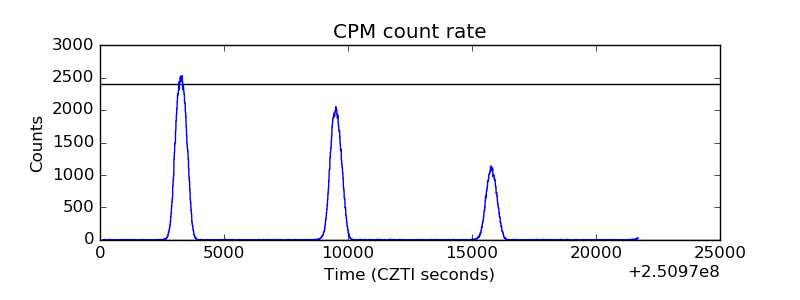 |
| CZT Counter |  |
| +2.5 Volts monitor |  |
| +5 Volts monitor | 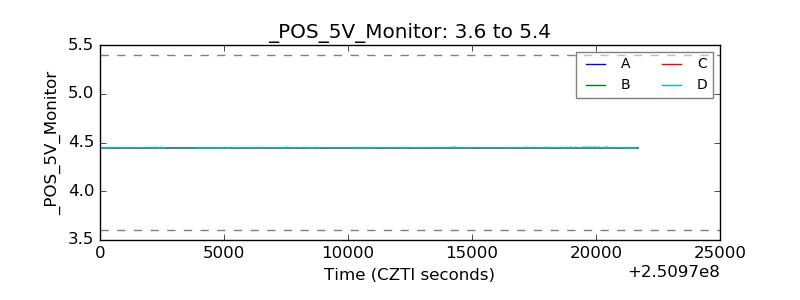 |
| _ROLL_ROT |  |
| _Roll_DEC |  |
| _Roll_RA |  |
| Veto Counter | 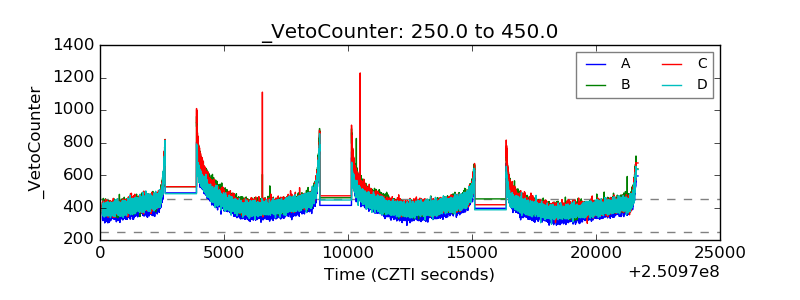 |