| Param | Original file | Final file |
|---|---|---|
| Filename | modeM0/AS1A04_124T01_9000001766cztM0_level2_bc.evt | modeM0/AS1A04_124T01_9000001766cztM0_level2_quad_clean.evt |
| Size (bytes) | 7,493,382,720 | 3,545,498,880 |
| Size | 7.0 GB | 3.3 GB |
| Events in quadrant A | 45,360,333 | 23,961,759 |
| Events in quadrant B | 60,017,421 | 24,088,774 |
| Events in quadrant C | 37,178,223 | 23,742,388 |
| Events in quadrant D | 71,158,902 | 22,297,683 |
| Mode SS | |||
|---|---|---|---|
| Quadrant | BADHDUFLAG | Total packets | Discarded packets |
| A | 0 | 3956 | 0 |
| B | 0 | 3956 | 0 |
| C | 0 | 3956 | 0 |
| D | 0 | 3956 | 0 |
| Mode M0 | |||
|---|---|---|---|
| Quadrant | BADHDUFLAG | Total packets | Discarded packets |
| A | 0 | 427719 | 0 |
| B | 0 | 482731 | 0 |
| C | 0 | 396443 | 0 |
| D | 0 | 503741 | 0 |
| Mode M9 | |||
|---|---|---|---|
| Quadrant | BADHDUFLAG | Total packets | Discarded packets |
| A | 0 | 281 | 0 |
| B | 0 | 281 | 0 |
| C | 0 | 281 | 0 |
| D | 0 | 281 | 0 |
| Quadrant | Total seconds | Saturated seconds | Saturation percentage |
|---|---|---|---|
| A | 194294 | 3268 | 1.681987% |
| B | 194294 | 8649 | 4.451501% |
| C | 194294 | 1116 | 0.574387% |
| D | 194294 | 8437 | 4.342388% |
Noise dominated data is calculated using 1-second bins in cleaned event files. If a bin has >2000 counts, and if more than 50% of those come from <1% of pixels, then it is considered to be noise-dominated and hence unusable.
| Quadrant | # 1 sec bins | Bins with >0 counts | Bins with >2000 counts | High rate bins dominated by noise | Noise dominated (total time) | Noise dominated (detector-on time) | Marked lightcurve |
|---|---|---|---|---|---|---|---|
| A | 222367 | 194273 | 205 | 205 | 0.09% | 0.11% |  |
| B | 222367 | 194270 | 178 | 178 | 0.08% | 0.09% | 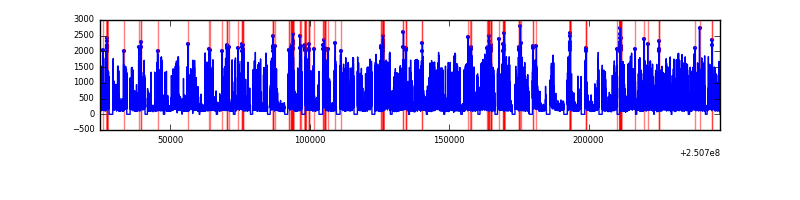 |
| C | 222367 | 194281 | 10 | 10 | 0.00% | 0.01% |  |
| D | 222367 | 194269 | 2077 | 2077 | 0.93% | 1.07% |  |
Top three noisy pixels from each quadrant. If the there are fewer than three noisy pixels in the level2.evt file, extra rows are filled as -1
| Pixel properties | Quadrant properties | ||||||
|---|---|---|---|---|---|---|---|
| Quadrant | DetID | PixID | Counts | Sigma | Mean | Median | Sigma |
| A | 14 | 63 | 2006211 | 949.42 | 9582 | 9395 | 2103.2 |
| A | 1 | 162 | 1667526 | 788.39 | 9582 | 9395 | 2103.2 |
| A | 6 | 254 | 1140610 | 537.86 | 9582 | 9395 | 2103.2 |
| B | 4 | 239 | 13250278 | 7069.14 | 9612 | 9330 | 1873.1 |
| B | 15 | 204 | 3741749 | 1992.68 | 9612 | 9330 | 1873.1 |
| B | 3 | 64 | 1923384 | 1021.88 | 9612 | 9330 | 1873.1 |
| C | 0 | 10 | 108352 | 47.83 | 9395 | 9284 | 2071.1 |
| C | 14 | 234 | 94993 | 41.38 | 9395 | 9284 | 2071.1 |
| C | 0 | 207 | 68683 | 28.68 | 9395 | 9284 | 2071.1 |
| D | 1 | 52 | 14625815 | 6598.52 | 9283 | 8937 | 2215.2 |
| D | 8 | 195 | 7424100 | 3347.44 | 9283 | 8937 | 2215.2 |
| D | 13 | 122 | 4759057 | 2144.35 | 9283 | 8937 | 2215.2 |
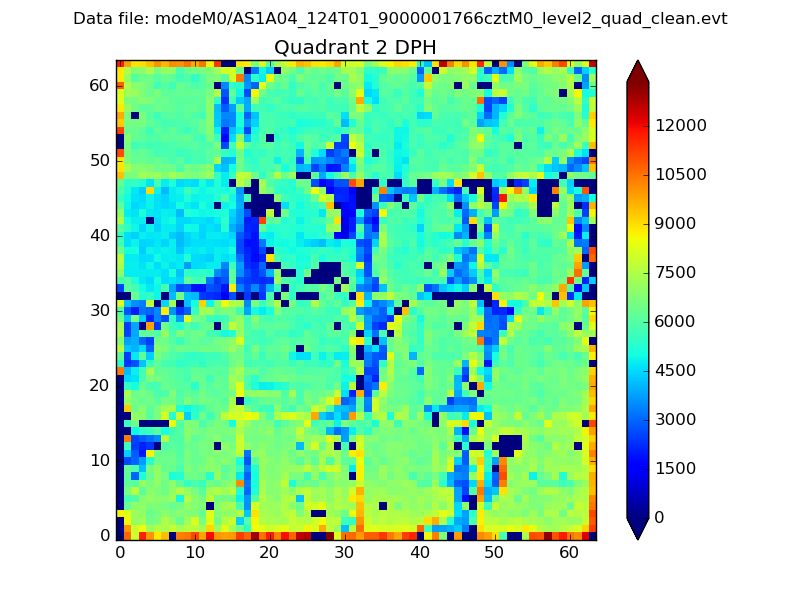
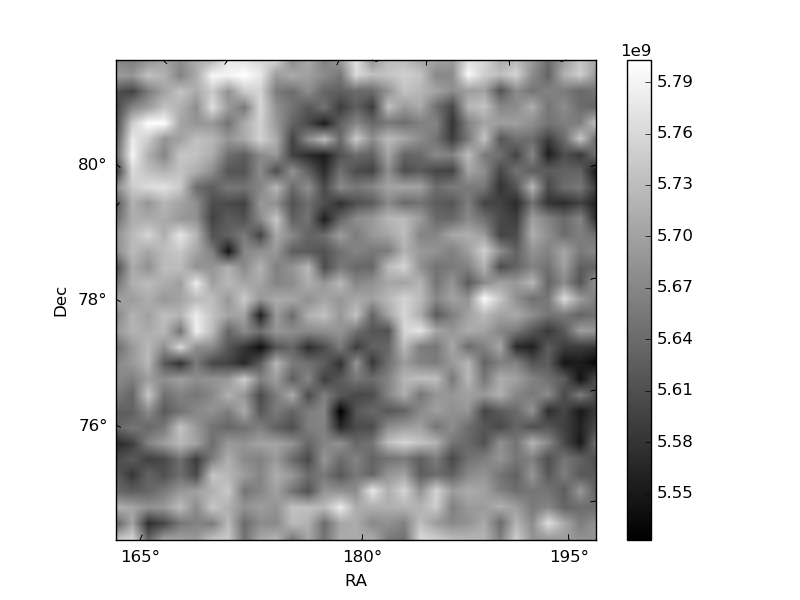
Histogram calculated using DETX and DETY for each event in the final _common_clean file
| Quadrant A |  |
 |
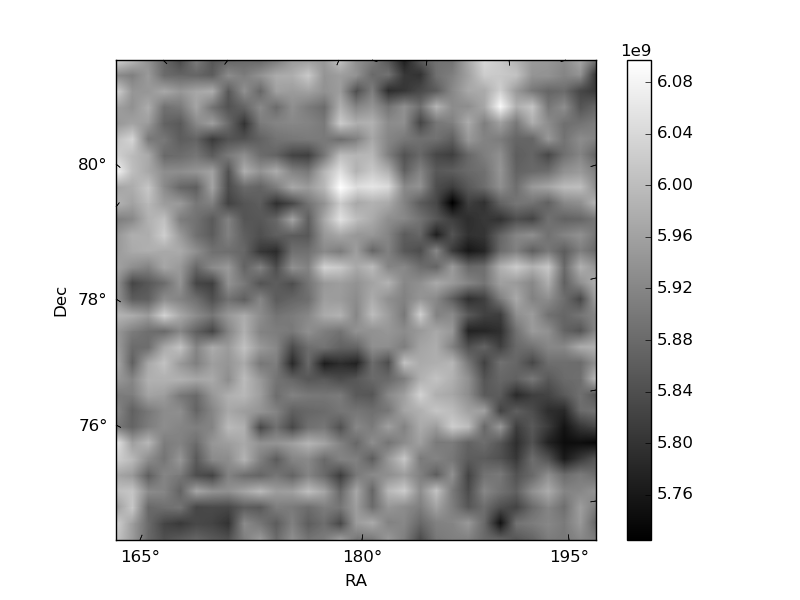
Quadrant B |
|---|---|---|---|
| Quadrant D | 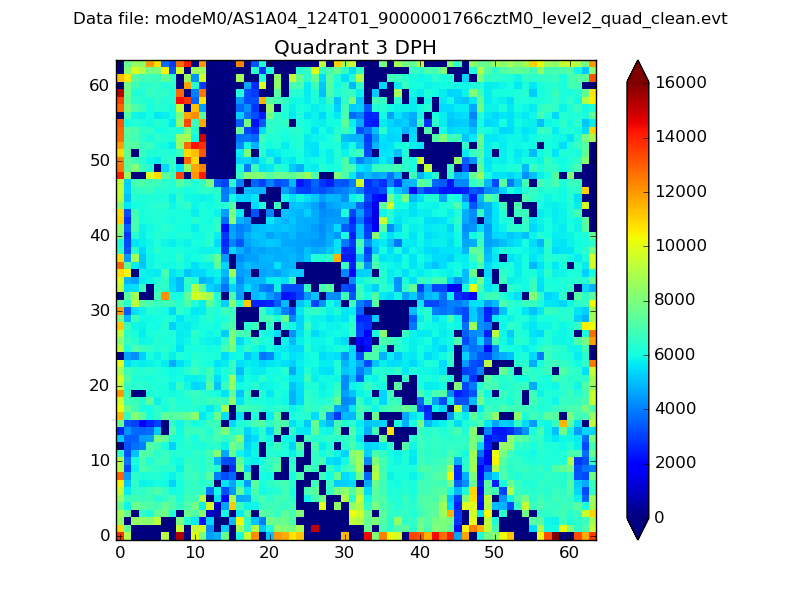 |
 |
Quadrant C |
| Plot type | Count rate plots | Images |
|---|---|---|
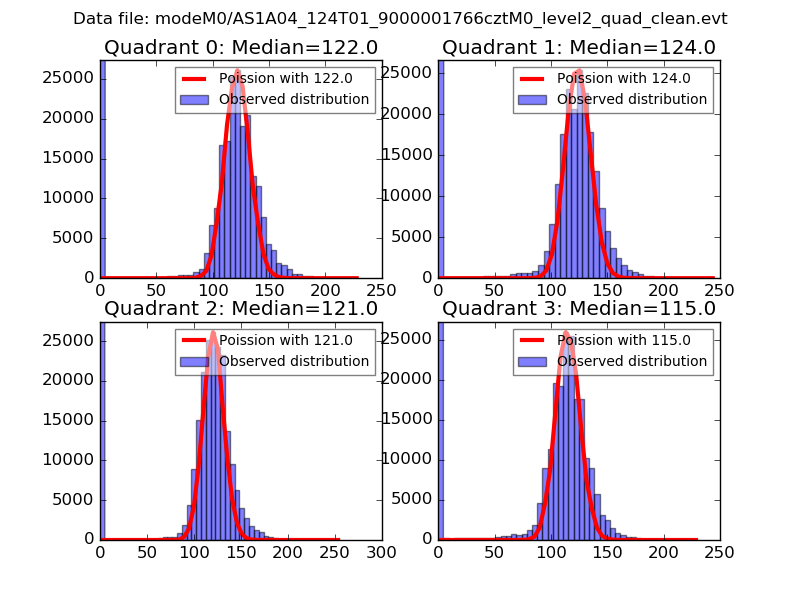
| Comparison with Poisson distribution Blue bars denote a histogram of data divided into 1 sec bins. Red curve is a Poisson curve with rate = median count rate of data. |
 |
 |
| Quadrant-wise count rates Data is divided into 100 sec bins |
 |
|
| Module-wise count rates for Quadrant A Data is divided into 100 sec bins |
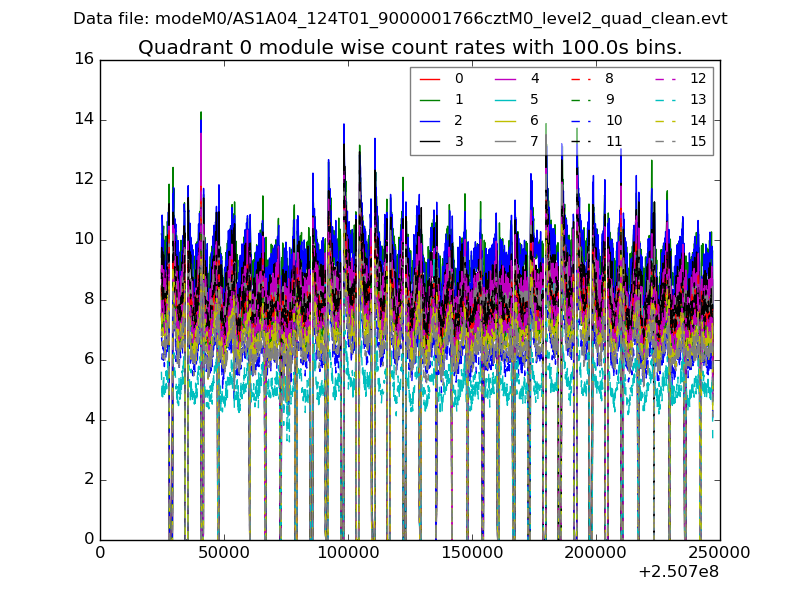 |
 |
| Module-wise count rates for Quadrant B Data is divided into 100 sec bins |
 |
 |
| Module-wise count rates for Quadrant C Data is divided into 100 sec bins |
 |
 |
| Module-wise count rates for Quadrant D Data is divided into 100 sec bins |
 |
 |
| Parameter | Plot |
|---|---|
| CZT HV Monitor | 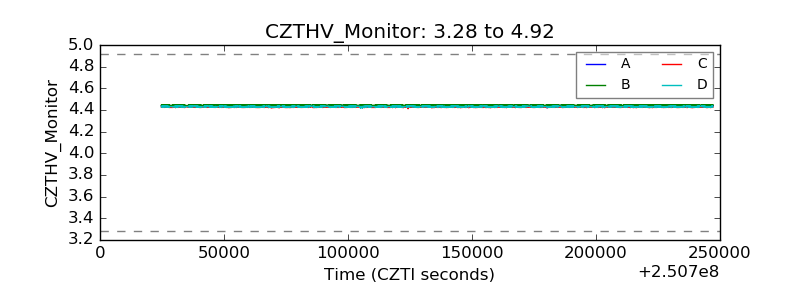 |
| D_VDD |  |
| Temperature 1 |  |
| Veto HV Monitor | 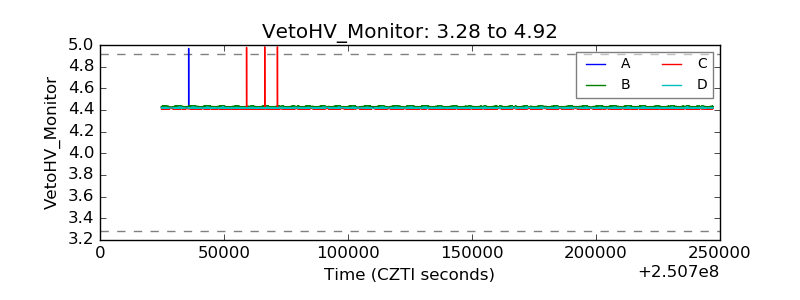 |
| Veto LLD | 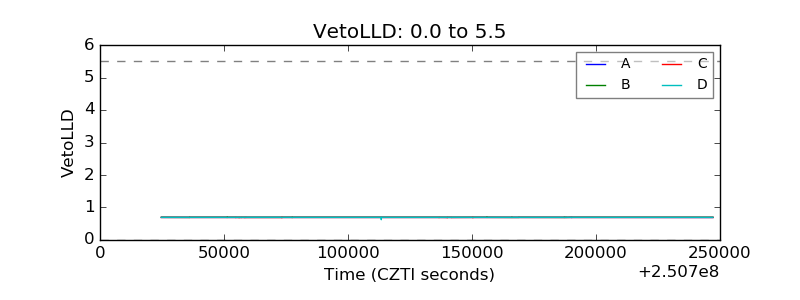 |
| Alpha Counter |  |
| _CPM_Rate | 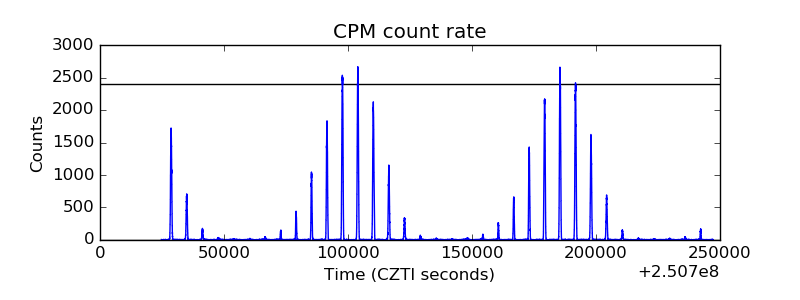 |
| CZT Counter |  |
| +2.5 Volts monitor | 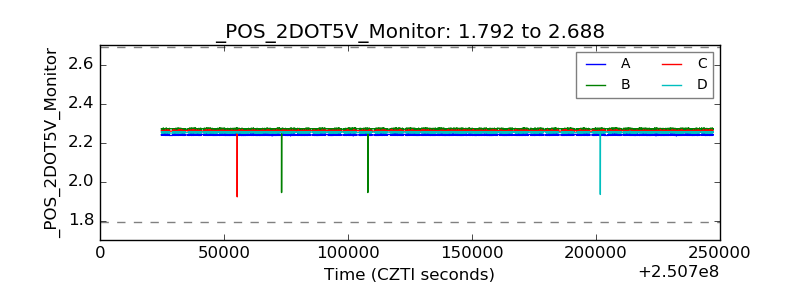 |
| +5 Volts monitor |  |
| _ROLL_ROT | 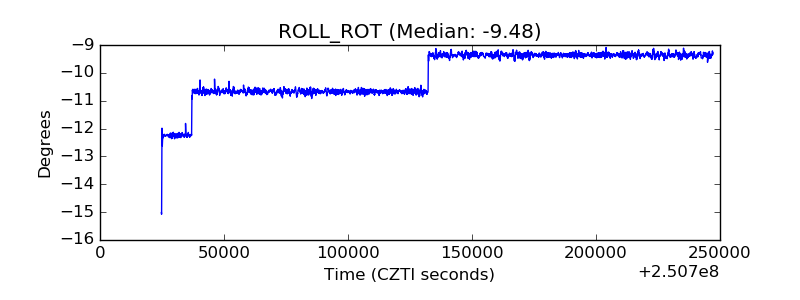 |
| _Roll_DEC |  |
| _Roll_RA |  |
| Veto Counter |  |