| Param | Original file | Final file |
|---|---|---|
| Filename | modeM0/AS1G08_083T04_9000001760cztM0_level2_bc.evt | modeM0/AS1G08_083T04_9000001760cztM0_level2_quad_clean.evt |
| Size (bytes) | 1,192,472,640 | 396,181,440 |
| Size | 1.1 GB | 377.8 MB |
| Events in quadrant A | 7,417,038 | 2,493,921 |
| Events in quadrant B | 10,494,234 | 2,451,882 |
| Events in quadrant C | 5,777,577 | 2,540,913 |
| Events in quadrant D | 10,348,555 | 2,422,719 |
| Mode M9 | |||
|---|---|---|---|
| Quadrant | BADHDUFLAG | Total packets | Discarded packets |
| A | 0 | 33 | 0 |
| B | 0 | 33 | 0 |
| C | 0 | 33 | 0 |
| D | 0 | 33 | 0 |
| Mode M0 | |||
|---|---|---|---|
| Quadrant | BADHDUFLAG | Total packets | Discarded packets |
| A | 0 | 68929 | 0 |
| B | 0 | 79148 | 0 |
| C | 0 | 62234 | 0 |
| D | 0 | 74288 | 0 |
| Mode SS | |||
|---|---|---|---|
| Quadrant | BADHDUFLAG | Total packets | Discarded packets |
| A | 0 | 622 | 0 |
| B | 0 | 622 | 0 |
| C | 0 | 622 | 0 |
| D | 0 | 622 | 0 |
| Quadrant | Total seconds | Saturated seconds | Saturation percentage |
|---|---|---|---|
| A | 30399 | 857 | 2.819172% |
| B | 30399 | 1571 | 5.167933% |
| C | 30399 | 422 | 1.388204% |
| D | 30399 | 1001 | 3.292871% |
Noise dominated data is calculated using 1-second bins in cleaned event files. If a bin has >2000 counts, and if more than 50% of those come from <1% of pixels, then it is considered to be noise-dominated and hence unusable.
| Quadrant | # 1 sec bins | Bins with >0 counts | Bins with >2000 counts | High rate bins dominated by noise | Noise dominated (total time) | Noise dominated (detector-on time) | Marked lightcurve |
|---|---|---|---|---|---|---|---|
| A | 33875 | 30401 | 20 | 20 | 0.06% | 0.07% |  |
| B | 33875 | 30400 | 55 | 55 | 0.16% | 0.18% |  |
| C | 33875 | 30401 | 4 | 4 | 0.01% | 0.01% |  |
| D | 33875 | 30402 | 116 | 116 | 0.34% | 0.38% | 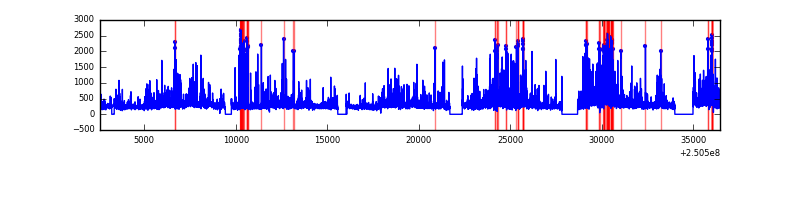 |
Top three noisy pixels from each quadrant. If the there are fewer than three noisy pixels in the level2.evt file, extra rows are filled as -1
| Pixel properties | Quadrant properties | ||||||
|---|---|---|---|---|---|---|---|
| Quadrant | DetID | PixID | Counts | Sigma | Mean | Median | Sigma |
| A | 8 | 15 | 667956 | 2065.75 | 1461 | 1429 | 322.7 |
| A | 7 | 144 | 663898 | 2053.18 | 1461 | 1429 | 322.7 |
| A | 1 | 162 | 266624 | 821.91 | 1461 | 1429 | 322.7 |
| B | 4 | 239 | 2189582 | 7729.03 | 1454 | 1411 | 283.1 |
| B | 3 | 64 | 1597687 | 5638.35 | 1454 | 1411 | 283.1 |
| B | 15 | 204 | 427966 | 1506.67 | 1454 | 1411 | 283.1 |
| C | 12 | 4 | 37675 | 108.29 | 1463 | 1431 | 334.7 |
| C | 13 | 61 | 8770 | 21.93 | 1463 | 1431 | 334.7 |
| C | 8 | 128 | 6072 | 13.87 | 1463 | 1431 | 334.7 |
| D | 8 | 195 | 1923815 | 5072.56 | 1450 | 1401 | 379.0 |
| D | 1 | 52 | 1299584 | 3425.44 | 1450 | 1401 | 379.0 |
| D | 13 | 104 | 277814 | 729.35 | 1450 | 1401 | 379.0 |
Histogram calculated using DETX and DETY for each event in the final _common_clean file
| Quadrant A |  |
 |
Quadrant B |
|---|---|---|---|
| Quadrant D |  |
 |
Quadrant C |
| Plot type | Count rate plots | Images |
|---|---|---|
| Comparison with Poisson distribution Blue bars denote a histogram of data divided into 1 sec bins. Red curve is a Poisson curve with rate = median count rate of data. |
 |
 |
| Quadrant-wise count rates Data is divided into 100 sec bins |
 |
|
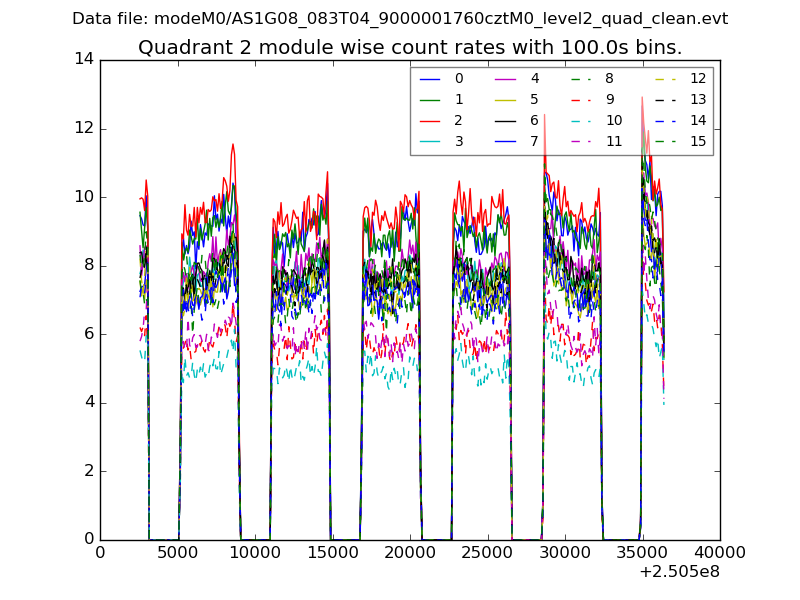
| Module-wise count rates for Quadrant A Data is divided into 100 sec bins |
 |
 |
| Module-wise count rates for Quadrant B Data is divided into 100 sec bins |
 |
 |
| Module-wise count rates for Quadrant C Data is divided into 100 sec bins |
 |
 |
| Module-wise count rates for Quadrant D Data is divided into 100 sec bins |
 |
 |
| Parameter | Plot |
|---|---|
| CZT HV Monitor |  |
| D_VDD |  |
| Temperature 1 |  |
| Veto HV Monitor |  |
| Veto LLD |  |
| Alpha Counter |  |
| _CPM_Rate |  |
| CZT Counter |  |
| +2.5 Volts monitor |  |
| +5 Volts monitor |  |
| _ROLL_ROT |  |
| _Roll_DEC |  |
| _Roll_RA |  |
| Veto Counter |  |