| Param | Original file | Final file |
|---|---|---|
| Filename | modeM0/AS1T01_209T01_9000001758cztM0_level2_bc.evt | modeM0/AS1T01_209T01_9000001758cztM0_level2_quad_clean.evt |
| Size (bytes) | 2,592,797,760 | 1,061,069,760 |
| Size | 2.4 GB | 1011.9 MB |
| Events in quadrant A | 18,575,642 | 6,923,575 |
| Events in quadrant B | 21,246,110 | 6,980,793 |
| Events in quadrant C | 13,112,375 | 6,976,664 |
| Events in quadrant D | 20,963,431 | 6,603,223 |
| Mode SS | |||
|---|---|---|---|
| Quadrant | BADHDUFLAG | Total packets | Discarded packets |
| A | 0 | 1386 | 0 |
| B | 0 | 1386 | 0 |
| C | 0 | 1386 | 0 |
| D | 0 | 1386 | 0 |
| Mode M0 | |||
|---|---|---|---|
| Quadrant | BADHDUFLAG | Total packets | Discarded packets |
| A | 0 | 158011 | 0 |
| B | 0 | 169536 | 0 |
| C | 0 | 138268 | 0 |
| D | 0 | 158481 | 0 |
| Mode M9 | |||
|---|---|---|---|
| Quadrant | BADHDUFLAG | Total packets | Discarded packets |
| A | 0 | 109 | 0 |
| B | 0 | 109 | 0 |
| C | 0 | 109 | 0 |
| D | 0 | 109 | 0 |
| Quadrant | Total seconds | Saturated seconds | Saturation percentage |
|---|---|---|---|
| A | 67883 | 1815 | 2.673718% |
| B | 67883 | 3162 | 4.658015% |
| C | 67883 | 566 | 0.833788% |
| D | 67883 | 1317 | 1.940103% |
Noise dominated data is calculated using 1-second bins in cleaned event files. If a bin has >2000 counts, and if more than 50% of those come from <1% of pixels, then it is considered to be noise-dominated and hence unusable.
| Quadrant | # 1 sec bins | Bins with >0 counts | Bins with >2000 counts | High rate bins dominated by noise | Noise dominated (total time) | Noise dominated (detector-on time) | Marked lightcurve |
|---|---|---|---|---|---|---|---|
| A | 78929 | 67889 | 384 | 384 | 0.49% | 0.57% |  |
| B | 78929 | 67886 | 23 | 23 | 0.03% | 0.03% |  |
| C | 78929 | 67888 | 23 | 23 | 0.03% | 0.03% |  |
| D | 78929 | 67887 | 108 | 108 | 0.14% | 0.16% | 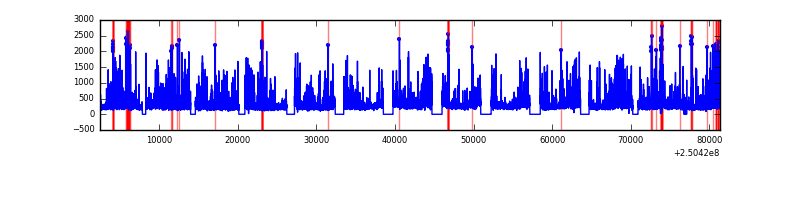 |
Top three noisy pixels from each quadrant. If the there are fewer than three noisy pixels in the level2.evt file, extra rows are filled as -1
| Pixel properties | Quadrant properties | ||||||
|---|---|---|---|---|---|---|---|
| Quadrant | DetID | PixID | Counts | Sigma | Mean | Median | Sigma |
| A | 7 | 144 | 3161656 | 4308.54 | 3339 | 3278 | 733.1 |
| A | 8 | 15 | 1205087 | 1639.46 | 3339 | 3278 | 733.1 |
| A | 1 | 162 | 586168 | 795.16 | 3339 | 3278 | 733.1 |
| B | 4 | 239 | 4858561 | 7663.32 | 3355 | 3271 | 633.6 |
| B | 15 | 204 | 978252 | 1538.86 | 3355 | 3271 | 633.6 |
| B | 15 | 185 | 457820 | 717.43 | 3355 | 3271 | 633.6 |
| C | 0 | 207 | 134350 | 181.41 | 3292 | 3251 | 722.6 |
| C | 1 | 16 | 57594 | 75.2 | 3292 | 3251 | 722.6 |
| C | 13 | 61 | 20397 | 23.73 | 3292 | 3251 | 722.6 |
| D | 8 | 195 | 3329191 | 4357.0 | 3282 | 3168 | 763.4 |
| D | 1 | 52 | 1596740 | 2087.54 | 3282 | 3168 | 763.4 |
| D | 12 | 233 | 581083 | 757.05 | 3282 | 3168 | 763.4 |
Histogram calculated using DETX and DETY for each event in the final _common_clean file
| Quadrant A | 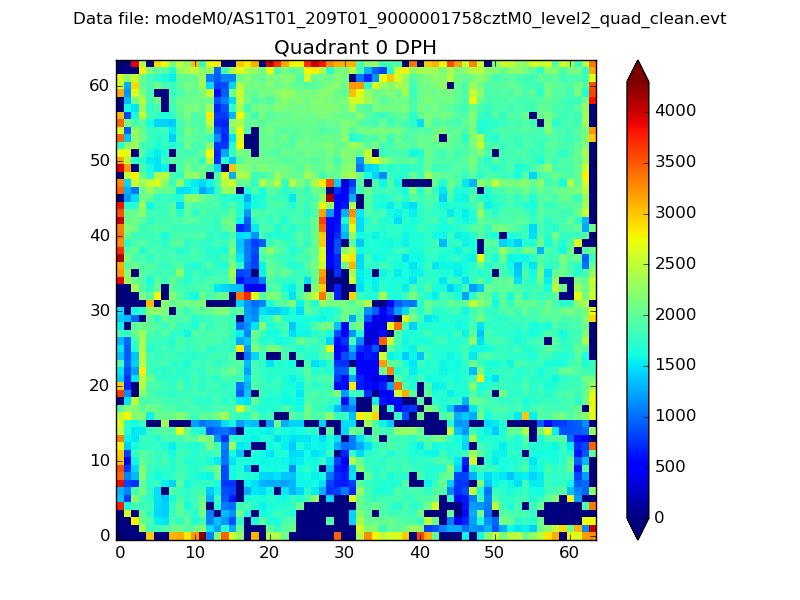 |
 |
Quadrant B |
|---|---|---|---|
| Quadrant D |  |
 |
Quadrant C |
| Plot type | Count rate plots | Images |
|---|---|---|
| Comparison with Poisson distribution Blue bars denote a histogram of data divided into 1 sec bins. Red curve is a Poisson curve with rate = median count rate of data. |
 |
 |
| Quadrant-wise count rates Data is divided into 100 sec bins |
 |
|
| Module-wise count rates for Quadrant A Data is divided into 100 sec bins |
 |
 |
| Module-wise count rates for Quadrant B Data is divided into 100 sec bins |
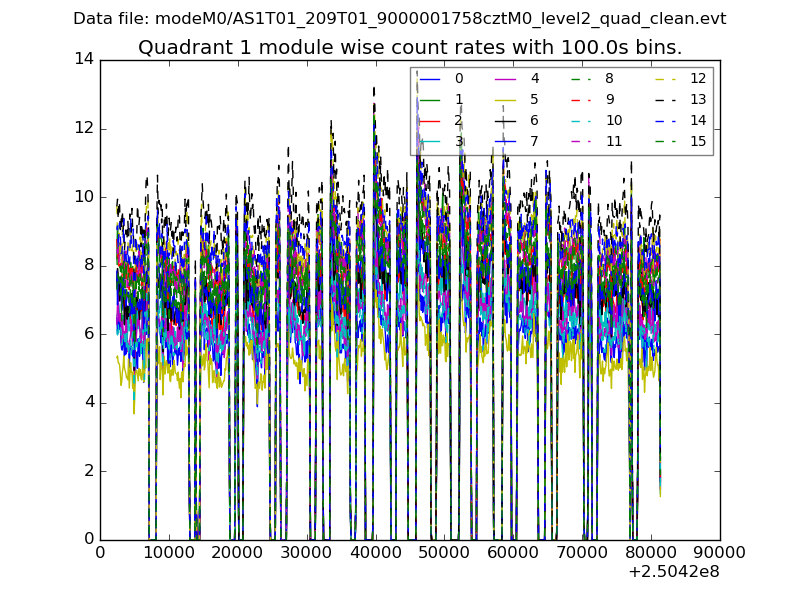 |
 |
| Module-wise count rates for Quadrant C Data is divided into 100 sec bins |
 |
 |
| Module-wise count rates for Quadrant D Data is divided into 100 sec bins |
 |
 |
| Parameter | Plot |
|---|---|
| CZT HV Monitor |  |
| D_VDD |  |
| Temperature 1 |  |
| Veto HV Monitor |  |
| Veto LLD |  |
| Alpha Counter | 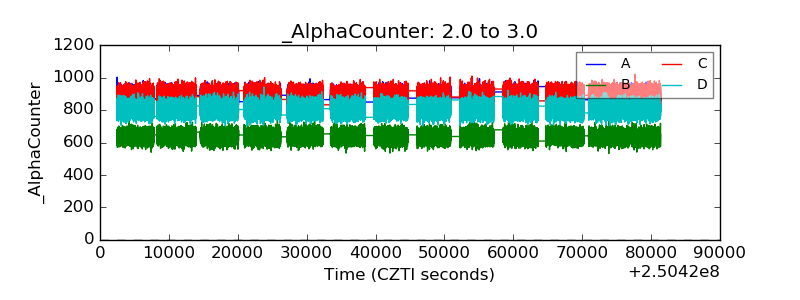 |
| _CPM_Rate |  |
| CZT Counter |  |
| +2.5 Volts monitor | 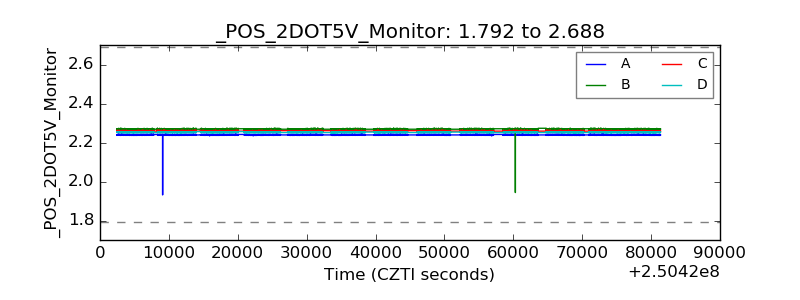 |
| +5 Volts monitor |  |
| _ROLL_ROT |  |
| _Roll_DEC |  |
| _Roll_RA |  |
| Veto Counter |  |