| Param | Original file | Final file |
|---|---|---|
| Filename | modeM0/AS1A04_145T01_9000001756cztM0_level2_bc.evt | modeM0/AS1A04_145T01_9000001756cztM0_level2_quad_clean.evt |
| Size (bytes) | 412,937,280 | 135,529,920 |
| Size | 393.8 MB | 129.3 MB |
| Events in quadrant A | 1,884,323 | 897,501 |
| Events in quadrant B | 2,722,114 | 881,570 |
| Events in quadrant C | 1,709,411 | 890,816 |
| Events in quadrant D | 5,577,326 | 817,265 |
| Mode SS | |||
|---|---|---|---|
| Quadrant | BADHDUFLAG | Total packets | Discarded packets |
| A | 0 | 178 | 0 |
| B | 0 | 178 | 0 |
| C | 0 | 178 | 0 |
| D | 0 | 178 | 0 |
| Mode M0 | |||
|---|---|---|---|
| Quadrant | BADHDUFLAG | Total packets | Discarded packets |
| A | 0 | 18976 | 0 |
| B | 0 | 22229 | 0 |
| C | 0 | 18262 | 0 |
| D | 0 | 29934 | 0 |
| Quadrant | Total seconds | Saturated seconds | Saturation percentage |
|---|---|---|---|
| A | 8890 | 286 | 3.217098% |
| B | 8890 | 591 | 6.647919% |
| C | 8890 | 167 | 1.878515% |
| D | 8890 | 824 | 9.268841% |
Noise dominated data is calculated using 1-second bins in cleaned event files. If a bin has >2000 counts, and if more than 50% of those come from <1% of pixels, then it is considered to be noise-dominated and hence unusable.
| Quadrant | # 1 sec bins | Bins with >0 counts | Bins with >2000 counts | High rate bins dominated by noise | Noise dominated (total time) | Noise dominated (detector-on time) | Marked lightcurve |
|---|---|---|---|---|---|---|---|
| A | 8891 | 8891 | 2 | 2 | 0.02% | 0.02% |  |
| B | 8891 | 8891 | 1 | 1 | 0.01% | 0.01% | 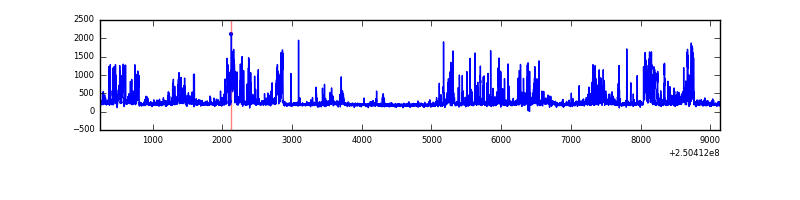 |
| C | 8891 | 8891 | 1 | 1 | 0.01% | 0.01% |  |
| D | 8891 | 8891 | 297 | 297 | 3.34% | 3.34% | 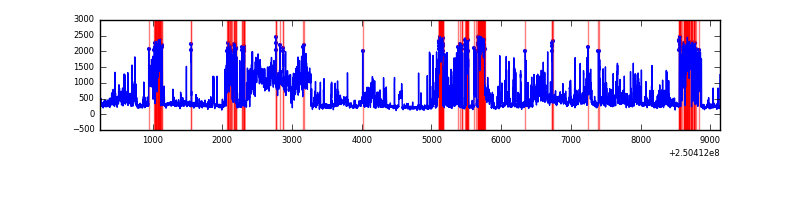 |
Top three noisy pixels from each quadrant. If the there are fewer than three noisy pixels in the level2.evt file, extra rows are filled as -1
| Pixel properties | Quadrant properties | ||||||
|---|---|---|---|---|---|---|---|
| Quadrant | DetID | PixID | Counts | Sigma | Mean | Median | Sigma |
| A | 8 | 15 | 97140 | 982.2 | 426 | 415 | 98.5 |
| A | 1 | 162 | 61837 | 623.71 | 426 | 415 | 98.5 |
| A | 7 | 144 | 45750 | 460.36 | 426 | 415 | 98.5 |
| B | 4 | 239 | 756162 | 9013.21 | 423 | 410 | 83.8 |
| B | 15 | 204 | 99903 | 1186.57 | 423 | 410 | 83.8 |
| B | 0 | 214 | 38550 | 454.86 | 423 | 410 | 83.8 |
| C | 7 | 247 | 36941 | 380.13 | 419 | 412 | 96.1 |
| C | 8 | 128 | 11969 | 120.27 | 419 | 412 | 96.1 |
| C | 8 | 112 | 7599 | 74.79 | 419 | 412 | 96.1 |
| D | 13 | 122 | 2304286 | 23515.53 | 409 | 393 | 98.0 |
| D | 1 | 52 | 873816 | 8914.91 | 409 | 393 | 98.0 |
| D | 8 | 195 | 483263 | 4928.59 | 409 | 393 | 98.0 |
Histogram calculated using DETX and DETY for each event in the final _common_clean file
| Quadrant A |  |
 |
Quadrant B |
|---|---|---|---|
| Quadrant D |  |
 |
Quadrant C |
| Plot type | Count rate plots | Images |
|---|---|---|
| Comparison with Poisson distribution Blue bars denote a histogram of data divided into 1 sec bins. Red curve is a Poisson curve with rate = median count rate of data. |
 |
 |
| Quadrant-wise count rates Data is divided into 100 sec bins |
 |
|
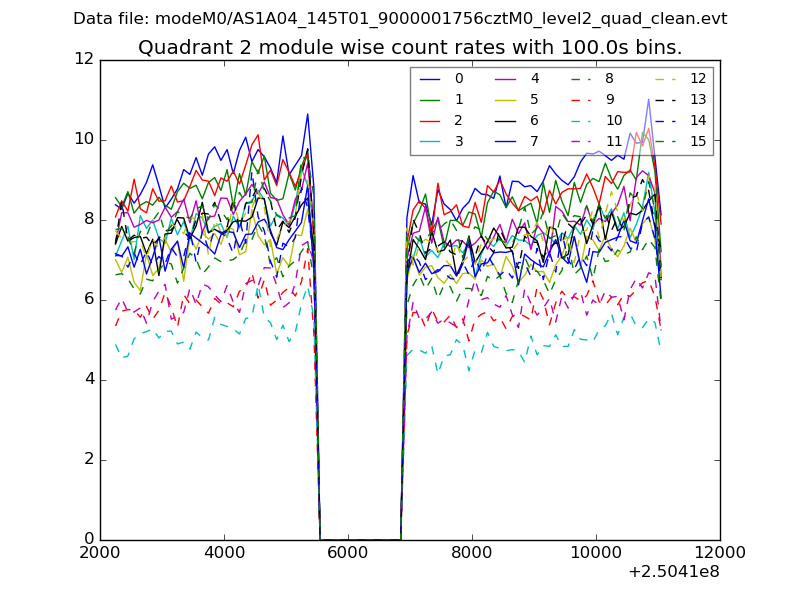
| Module-wise count rates for Quadrant A Data is divided into 100 sec bins |
 |
 |
| Module-wise count rates for Quadrant B Data is divided into 100 sec bins |
 |
 |
| Module-wise count rates for Quadrant C Data is divided into 100 sec bins |
 |
 |
| Module-wise count rates for Quadrant D Data is divided into 100 sec bins |
 |
 |
| Parameter | Plot |
|---|---|
| CZT HV Monitor |  |
| D_VDD |  |
| Temperature 1 |  |
| Veto HV Monitor | 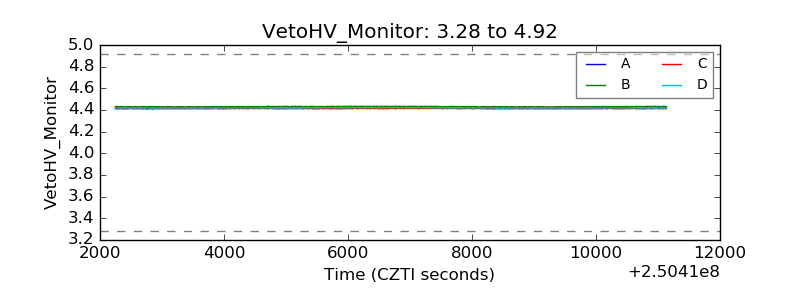 |
| Veto LLD |  |
| Alpha Counter |  |
| _CPM_Rate |  |
| CZT Counter |  |
| +2.5 Volts monitor | 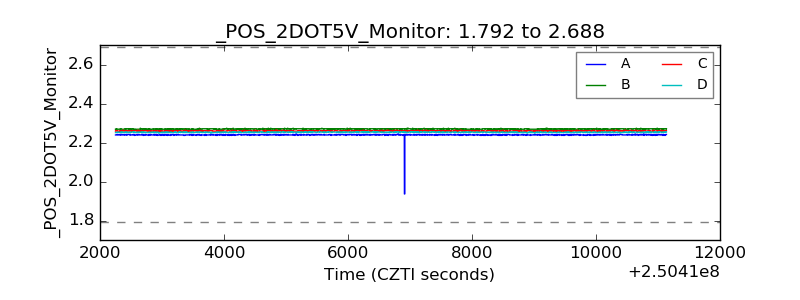 |
| +5 Volts monitor |  |
| _ROLL_ROT |  |
| _Roll_DEC |  |
| _Roll_RA |  |
| Veto Counter |  |