| Param | Original file | Final file |
|---|---|---|
| Filename | modeM0/AS1G08_048T01_9000001752cztM0_level2_bc.evt | modeM0/AS1G08_048T01_9000001752cztM0_level2_quad_clean.evt |
| Size (bytes) | 868,152,960 | 287,723,520 |
| Size | 827.9 MB | 274.4 MB |
| Events in quadrant A | 5,205,156 | 1,811,071 |
| Events in quadrant B | 7,411,764 | 1,768,469 |
| Events in quadrant C | 4,662,866 | 1,779,997 |
| Events in quadrant D | 7,356,033 | 1,688,383 |
| Mode M9 | |||
|---|---|---|---|
| Quadrant | BADHDUFLAG | Total packets | Discarded packets |
| A | 0 | 50 | 0 |
| B | 0 | 50 | 0 |
| C | 0 | 50 | 0 |
| D | 0 | 50 | 0 |
| Mode SS | |||
|---|---|---|---|
| Quadrant | BADHDUFLAG | Total packets | Discarded packets |
| A | 0 | 494 | 0 |
| B | 0 | 494 | 0 |
| C | 0 | 494 | 0 |
| D | 0 | 494 | 0 |
| Mode M0 | |||
|---|---|---|---|
| Quadrant | BADHDUFLAG | Total packets | Discarded packets |
| A | 0 | 51985 | 0 |
| B | 0 | 61239 | 0 |
| C | 0 | 49268 | 0 |
| D | 0 | 56833 | 0 |
| Quadrant | Total seconds | Saturated seconds | Saturation percentage |
|---|---|---|---|
| A | 24221 | 235 | 0.970232% |
| B | 24221 | 1281 | 5.288799% |
| C | 24221 | 84 | 0.346806% |
| D | 24221 | 403 | 1.663845% |
Noise dominated data is calculated using 1-second bins in cleaned event files. If a bin has >2000 counts, and if more than 50% of those come from <1% of pixels, then it is considered to be noise-dominated and hence unusable.
| Quadrant | # 1 sec bins | Bins with >0 counts | Bins with >2000 counts | High rate bins dominated by noise | Noise dominated (total time) | Noise dominated (detector-on time) | Marked lightcurve |
|---|---|---|---|---|---|---|---|
| A | 29262 | 24223 | 0 | 0 | 0.00% | 0.00% | 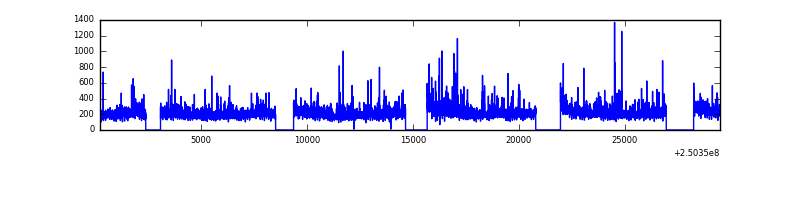 |
| B | 29262 | 24222 | 49 | 49 | 0.17% | 0.20% |  |
| C | 29262 | 24222 | 0 | 0 | 0.00% | 0.00% |  |
| D | 29262 | 24222 | 105 | 105 | 0.36% | 0.43% |  |
Top three noisy pixels from each quadrant. If the there are fewer than three noisy pixels in the level2.evt file, extra rows are filled as -1
| Pixel properties | Quadrant properties | ||||||
|---|---|---|---|---|---|---|---|
| Quadrant | DetID | PixID | Counts | Sigma | Mean | Median | Sigma |
| A | 1 | 162 | 194656 | 712.34 | 1217 | 1189 | 271.6 |
| A | 8 | 15 | 155950 | 569.82 | 1217 | 1189 | 271.6 |
| A | 13 | 251 | 85449 | 310.24 | 1217 | 1189 | 271.6 |
| B | 4 | 239 | 1857258 | 7977.25 | 1206 | 1174 | 232.7 |
| B | 3 | 64 | 310734 | 1330.45 | 1206 | 1174 | 232.7 |
| B | 15 | 204 | 147952 | 630.84 | 1206 | 1174 | 232.7 |
| C | 13 | 61 | 7121 | 22.8 | 1189 | 1173 | 260.8 |
| C | 12 | 4 | 5334 | 15.95 | 1189 | 1173 | 260.8 |
| C | 7 | 247 | 4120 | 11.3 | 1189 | 1173 | 260.8 |
| D | 1 | 52 | 1362350 | 4998.39 | 1178 | 1133 | 272.3 |
| D | 8 | 195 | 940766 | 3450.33 | 1178 | 1133 | 272.3 |
| D | 13 | 104 | 121301 | 441.26 | 1178 | 1133 | 272.3 |
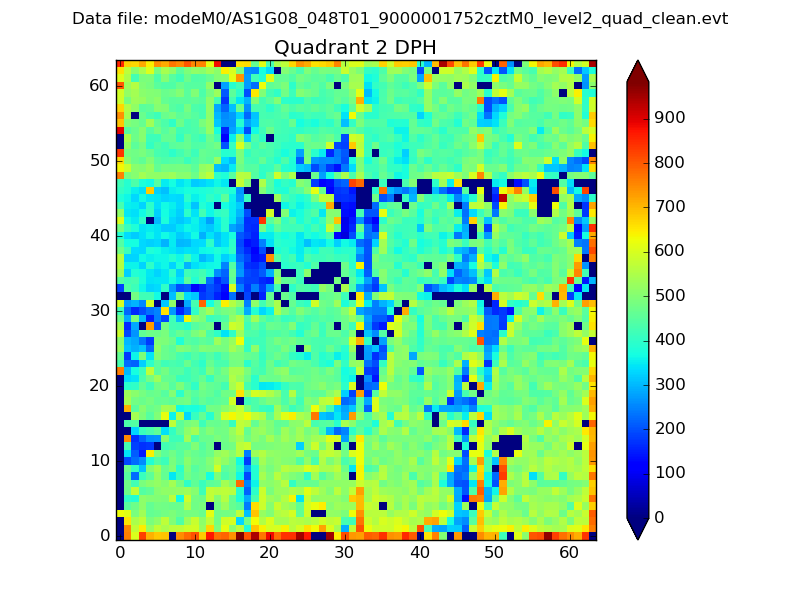
Histogram calculated using DETX and DETY for each event in the final _common_clean file
| Quadrant A |  |
 |
Quadrant B |
|---|---|---|---|
| Quadrant D |  |
 |
Quadrant C |
| Plot type | Count rate plots | Images |
|---|---|---|
| Comparison with Poisson distribution Blue bars denote a histogram of data divided into 1 sec bins. Red curve is a Poisson curve with rate = median count rate of data. |
 |
 |
| Quadrant-wise count rates Data is divided into 100 sec bins |
 |
|
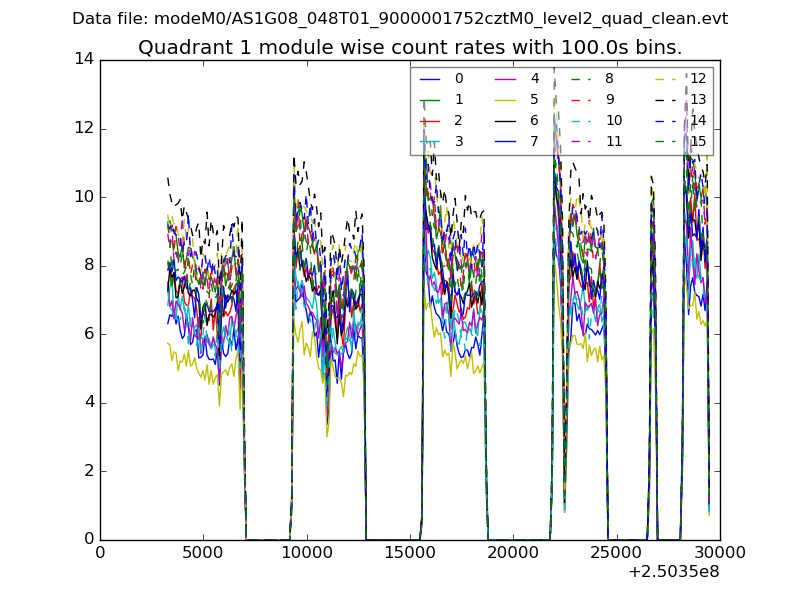
| Module-wise count rates for Quadrant A Data is divided into 100 sec bins |
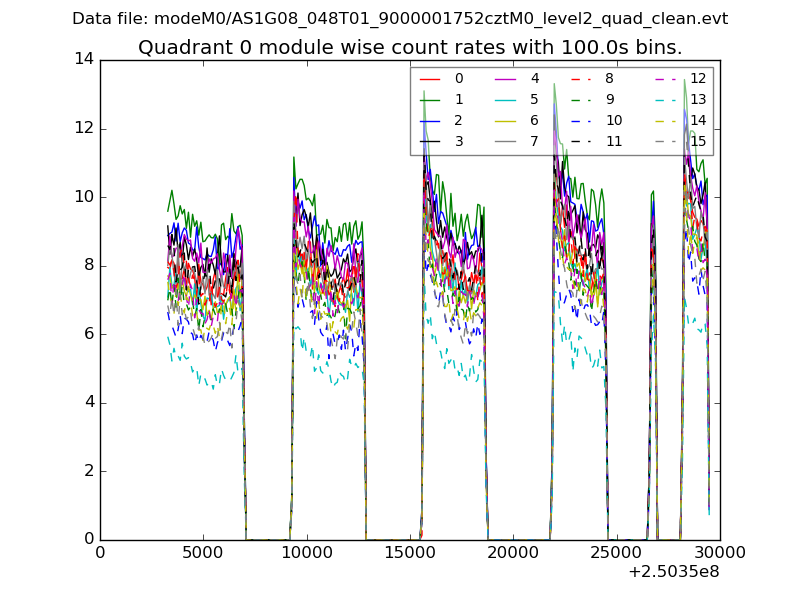 |
 |
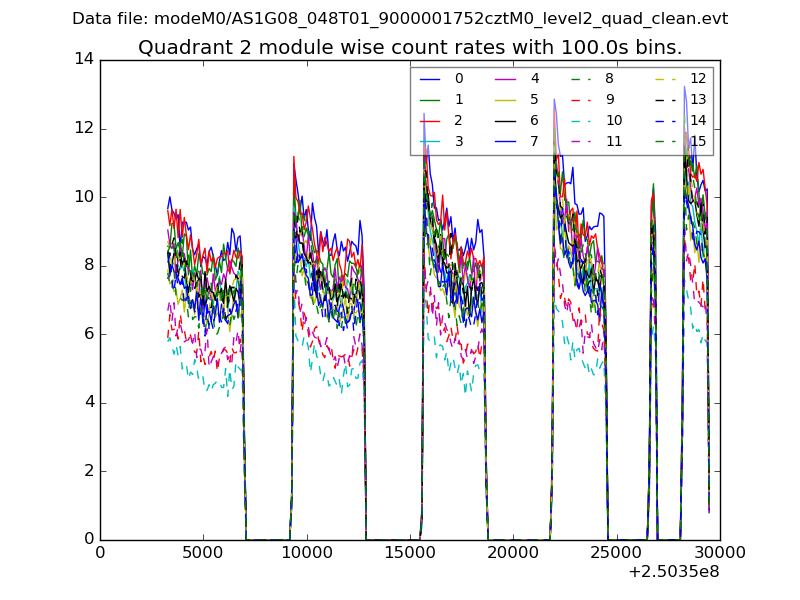
| Module-wise count rates for Quadrant B Data is divided into 100 sec bins |
 |
 |
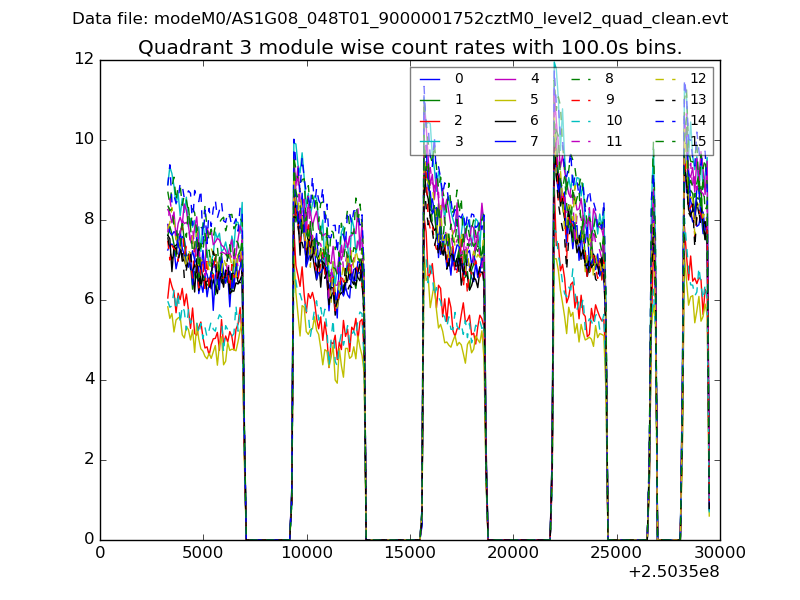
| Module-wise count rates for Quadrant C Data is divided into 100 sec bins |
 |
 |
| Module-wise count rates for Quadrant D Data is divided into 100 sec bins |
 |
 |
| Parameter | Plot |
|---|---|
| CZT HV Monitor |  |
| D_VDD |  |
| Temperature 1 | 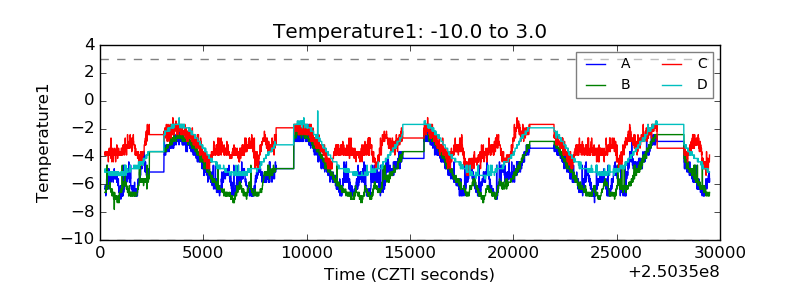 |
| Veto HV Monitor |  |
| Veto LLD | 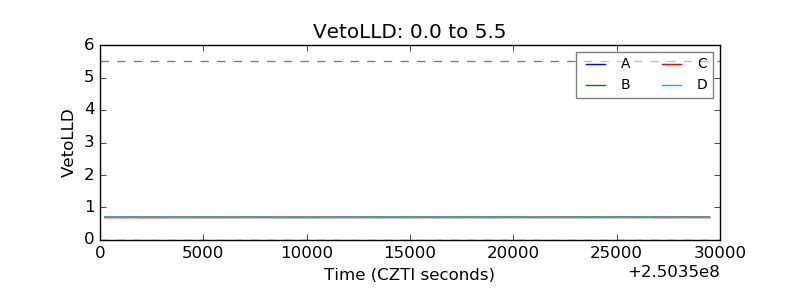 |
| Alpha Counter |  |
| _CPM_Rate |  |
| CZT Counter |  |
| +2.5 Volts monitor |  |
| +5 Volts monitor |  |
| _ROLL_ROT |  |
| _Roll_DEC |  |
| _Roll_RA |  |
| Veto Counter |  |