| Param | Original file | Final file |
|---|---|---|
| Filename | modeM0/AS1A04_049T01_9000001754cztM0_level2_bc.evt | modeM0/AS1A04_049T01_9000001754cztM0_level2_quad_clean.evt |
| Size (bytes) | 942,854,400 | 338,408,640 |
| Size | 899.2 MB | 322.7 MB |
| Events in quadrant A | 5,529,660 | 2,142,587 |
| Events in quadrant B | 8,087,165 | 2,137,437 |
| Events in quadrant C | 5,084,864 | 2,160,305 |
| Events in quadrant D | 8,085,919 | 2,031,829 |
| Mode M9 | |||
|---|---|---|---|
| Quadrant | BADHDUFLAG | Total packets | Discarded packets |
| A | 0 | 53 | 0 |
| B | 0 | 53 | 0 |
| C | 0 | 53 | 0 |
| D | 0 | 53 | 0 |
| Mode SS | |||
|---|---|---|---|
| Quadrant | BADHDUFLAG | Total packets | Discarded packets |
| A | 0 | 528 | 0 |
| B | 0 | 528 | 0 |
| C | 0 | 528 | 0 |
| D | 0 | 528 | 0 |
| Mode M0 | |||
|---|---|---|---|
| Quadrant | BADHDUFLAG | Total packets | Discarded packets |
| A | 0 | 55240 | 0 |
| B | 0 | 64610 | 0 |
| C | 0 | 52876 | 0 |
| D | 0 | 62839 | 0 |
| Quadrant | Total seconds | Saturated seconds | Saturation percentage |
|---|---|---|---|
| A | 25838 | 342 | 1.323632% |
| B | 25838 | 1176 | 4.551436% |
| C | 25838 | 171 | 0.661816% |
| D | 25838 | 933 | 3.610961% |
Noise dominated data is calculated using 1-second bins in cleaned event files. If a bin has >2000 counts, and if more than 50% of those come from <1% of pixels, then it is considered to be noise-dominated and hence unusable.
| Quadrant | # 1 sec bins | Bins with >0 counts | Bins with >2000 counts | High rate bins dominated by noise | Noise dominated (total time) | Noise dominated (detector-on time) | Marked lightcurve |
|---|---|---|---|---|---|---|---|
| A | 31154 | 25839 | 0 | 0 | 0.00% | 0.00% |  |
| B | 31154 | 25839 | 6 | 6 | 0.02% | 0.02% |  |
| C | 31154 | 25839 | 4 | 4 | 0.01% | 0.02% |  |
| D | 31154 | 25840 | 49 | 49 | 0.16% | 0.19% |  |
Top three noisy pixels from each quadrant. If the there are fewer than three noisy pixels in the level2.evt file, extra rows are filled as -1
| Pixel properties | Quadrant properties | ||||||
|---|---|---|---|---|---|---|---|
| Quadrant | DetID | PixID | Counts | Sigma | Mean | Median | Sigma |
| A | 1 | 162 | 214574 | 760.23 | 1292 | 1268 | 280.6 |
| A | 8 | 15 | 203758 | 721.68 | 1292 | 1268 | 280.6 |
| A | 3 | 1 | 30926 | 105.7 | 1292 | 1268 | 280.6 |
| B | 4 | 239 | 1577698 | 6468.42 | 1298 | 1266 | 243.7 |
| B | 3 | 64 | 536795 | 2197.38 | 1298 | 1266 | 243.7 |
| B | 15 | 185 | 273145 | 1115.57 | 1298 | 1266 | 243.7 |
| C | 0 | 207 | 23131 | 76.32 | 1288 | 1273 | 286.4 |
| C | 13 | 61 | 8032 | 23.6 | 1288 | 1273 | 286.4 |
| C | 8 | 128 | 6418 | 17.96 | 1288 | 1273 | 286.4 |
| D | 8 | 195 | 980003 | 3338.54 | 1259 | 1214 | 293.2 |
| D | 1 | 52 | 812891 | 2768.54 | 1259 | 1214 | 293.2 |
| D | 13 | 122 | 606598 | 2064.9 | 1259 | 1214 | 293.2 |
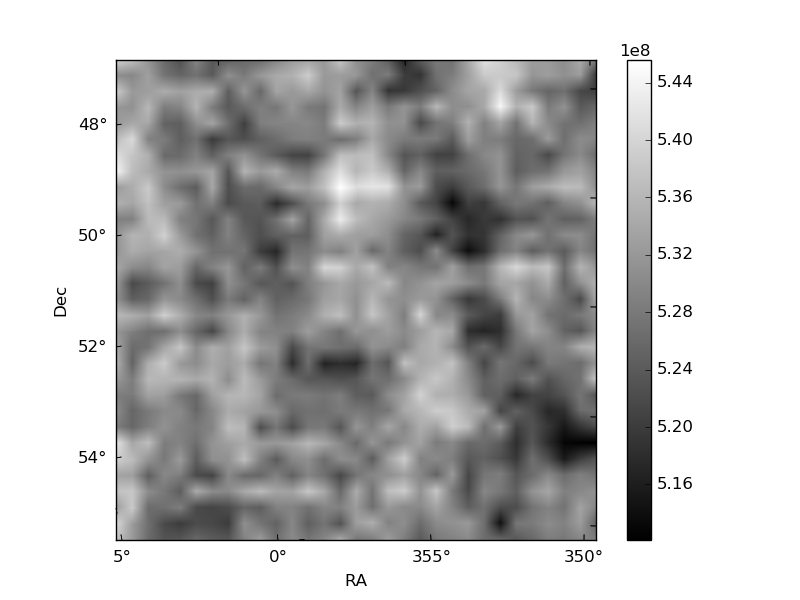
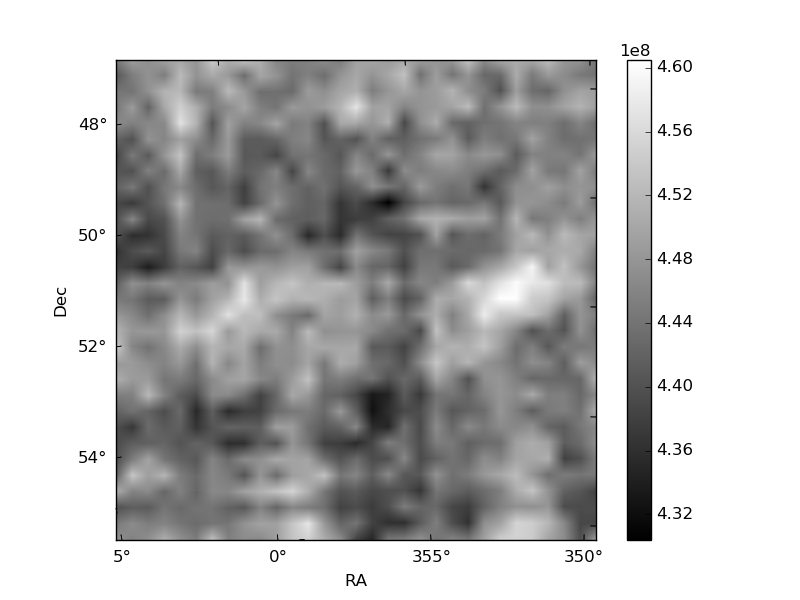
Histogram calculated using DETX and DETY for each event in the final _common_clean file
| Quadrant A |  |
 |
Quadrant B |
|---|---|---|---|
| Quadrant D |  |
 |
Quadrant C |
| Plot type | Count rate plots | Images |
|---|---|---|
| Comparison with Poisson distribution Blue bars denote a histogram of data divided into 1 sec bins. Red curve is a Poisson curve with rate = median count rate of data. |
 |
 |
| Quadrant-wise count rates Data is divided into 100 sec bins |
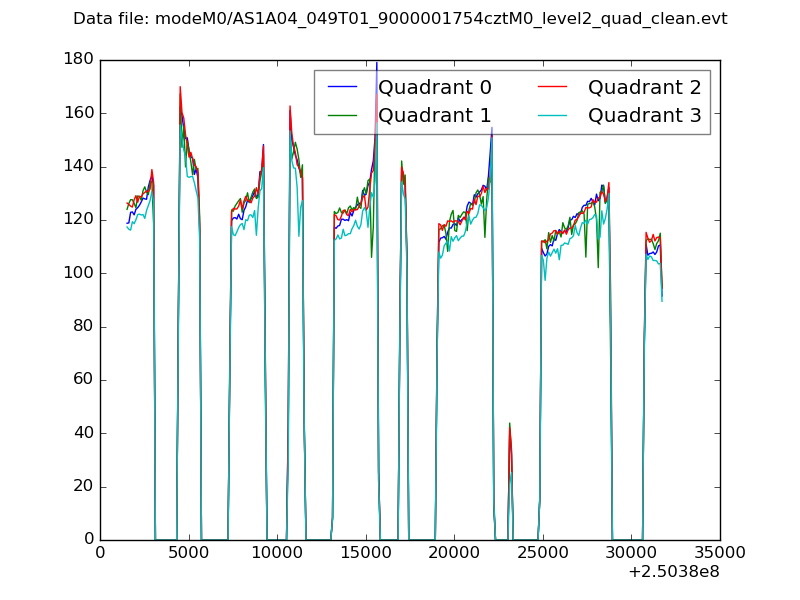 |
|
| Module-wise count rates for Quadrant A Data is divided into 100 sec bins |
 |
 |
| Module-wise count rates for Quadrant B Data is divided into 100 sec bins |
 |
 |
| Module-wise count rates for Quadrant C Data is divided into 100 sec bins |
 |
 |
| Module-wise count rates for Quadrant D Data is divided into 100 sec bins |
 |
 |
| Parameter | Plot |
|---|---|
| CZT HV Monitor |  |
| D_VDD |  |
| Temperature 1 |  |
| Veto HV Monitor | 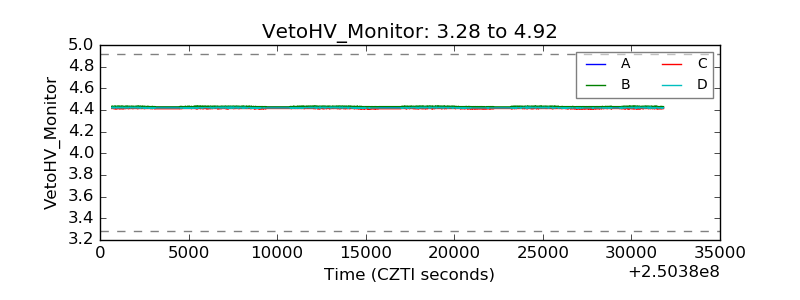 |
| Veto LLD |  |
| Alpha Counter |  |
| _CPM_Rate |  |
| CZT Counter |  |
| +2.5 Volts monitor | 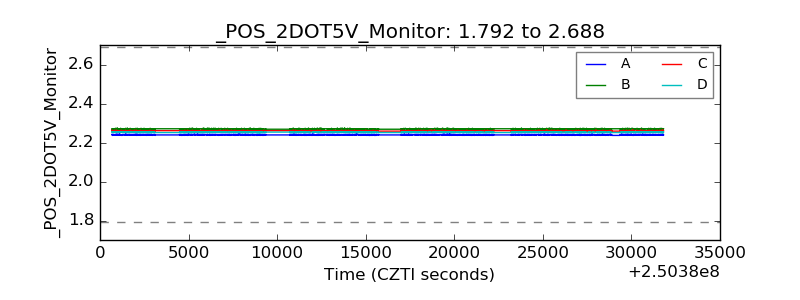 |
| +5 Volts monitor | 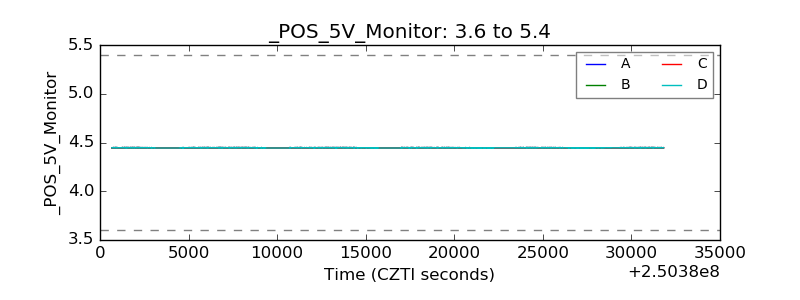 |
| _ROLL_ROT |  |
| _Roll_DEC |  |
| _Roll_RA |  |
| Veto Counter | 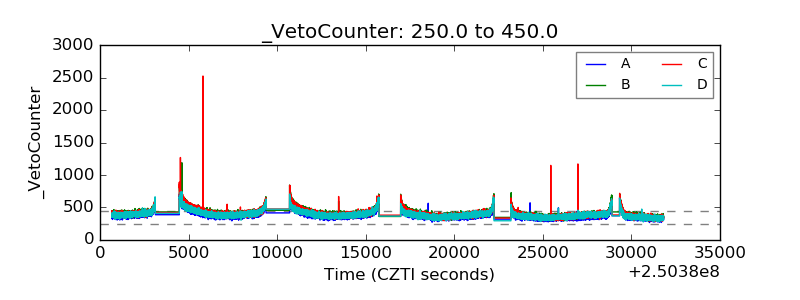 |