| Param | Original file | Final file |
|---|---|---|
| Filename | modeM0/AS1A04_088T03_9000001750cztM0_level2_bc.evt | modeM0/AS1A04_088T03_9000001750cztM0_level2_quad_clean.evt |
| Size (bytes) | 5,018,250,240 | 1,812,911,040 |
| Size | 4.7 GB | 1.7 GB |
| Events in quadrant A | 29,702,034 | 11,626,360 |
| Events in quadrant B | 45,802,240 | 11,430,665 |
| Events in quadrant C | 26,916,528 | 11,389,291 |
| Events in quadrant D | 40,063,062 | 10,914,810 |
| Mode M9 | |||
|---|---|---|---|
| Quadrant | BADHDUFLAG | Total packets | Discarded packets |
| A | 0 | 214 | 0 |
| B | 0 | 214 | 0 |
| C | 0 | 214 | 0 |
| D | 0 | 214 | 0 |
| Mode M0 | |||
|---|---|---|---|
| Quadrant | BADHDUFLAG | Total packets | Discarded packets |
| A | 0 | 298918 | 0 |
| B | 0 | 360020 | 0 |
| C | 0 | 285812 | 0 |
| D | 0 | 327120 | 0 |
| Mode SS | |||
|---|---|---|---|
| Quadrant | BADHDUFLAG | Total packets | Discarded packets |
| A | 0 | 2842 | 0 |
| B | 0 | 2842 | 0 |
| C | 0 | 2842 | 0 |
| D | 0 | 2842 | 0 |
| Quadrant | Total seconds | Saturated seconds | Saturation percentage |
|---|---|---|---|
| A | 139368 | 2234 | 1.602950% |
| B | 139368 | 7694 | 5.520636% |
| C | 139368 | 1337 | 0.959331% |
| D | 139367 | 3809 | 2.733072% |
Noise dominated data is calculated using 1-second bins in cleaned event files. If a bin has >2000 counts, and if more than 50% of those come from <1% of pixels, then it is considered to be noise-dominated and hence unusable.
| Quadrant | # 1 sec bins | Bins with >0 counts | Bins with >2000 counts | High rate bins dominated by noise | Noise dominated (total time) | Noise dominated (detector-on time) | Marked lightcurve |
|---|---|---|---|---|---|---|---|
| A | 161019 | 139372 | 0 | 0 | 0.00% | 0.00% |  |
| B | 161019 | 139370 | 146 | 146 | 0.09% | 0.10% | 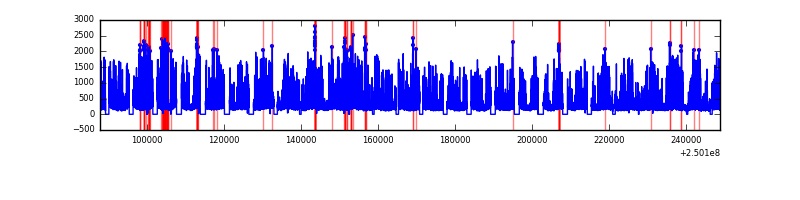 |
| C | 161019 | 139372 | 2 | 2 | 0.00% | 0.00% |  |
| D | 161019 | 139368 | 599 | 599 | 0.37% | 0.43% |  |
Top three noisy pixels from each quadrant. If the there are fewer than three noisy pixels in the level2.evt file, extra rows are filled as -1
| Pixel properties | Quadrant properties | ||||||
|---|---|---|---|---|---|---|---|
| Quadrant | DetID | PixID | Counts | Sigma | Mean | Median | Sigma |
| A | 1 | 162 | 1104819 | 719.65 | 7056 | 6927 | 1525.6 |
| A | 8 | 15 | 356291 | 229.0 | 7056 | 6927 | 1525.6 |
| A | 13 | 252 | 188555 | 119.05 | 7056 | 6927 | 1525.6 |
| B | 4 | 239 | 8836448 | 6733.03 | 6948 | 6758 | 1311.4 |
| B | 3 | 64 | 3737522 | 2844.87 | 6948 | 6758 | 1311.4 |
| B | 15 | 204 | 3278277 | 2494.68 | 6948 | 6758 | 1311.4 |
| C | 7 | 238 | 60893 | 36.38 | 6827 | 6728 | 1489.0 |
| C | 0 | 10 | 45778 | 26.23 | 6827 | 6728 | 1489.0 |
| C | 13 | 61 | 41369 | 23.27 | 6827 | 6728 | 1489.0 |
| D | 1 | 52 | 7339506 | 4650.3 | 6813 | 6559 | 1576.9 |
| D | 8 | 195 | 1494336 | 943.5 | 6813 | 6559 | 1576.9 |
| D | 13 | 122 | 1293800 | 816.32 | 6813 | 6559 | 1576.9 |
Histogram calculated using DETX and DETY for each event in the final _common_clean file
| Quadrant A | 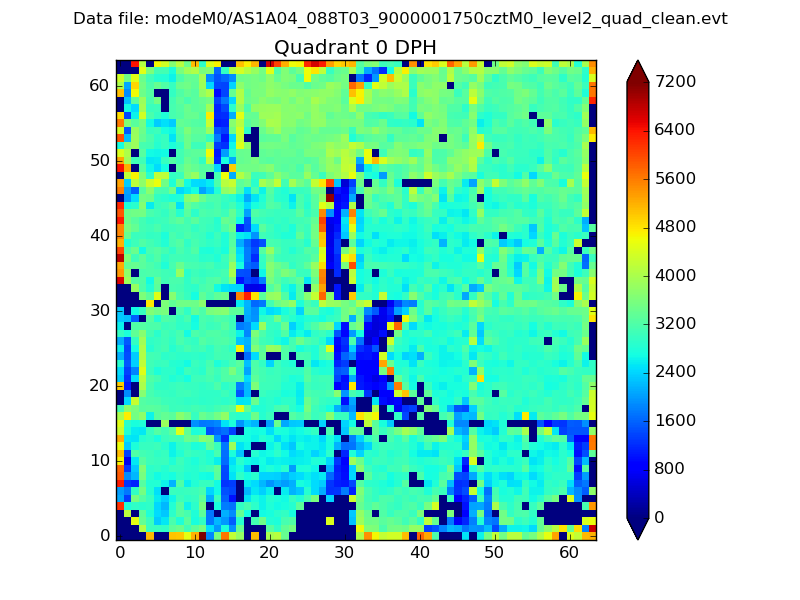 |
 |
Quadrant B |
|---|---|---|---|
| Quadrant D |  |
 |
Quadrant C |
| Plot type | Count rate plots | Images |
|---|---|---|
| Comparison with Poisson distribution Blue bars denote a histogram of data divided into 1 sec bins. Red curve is a Poisson curve with rate = median count rate of data. |
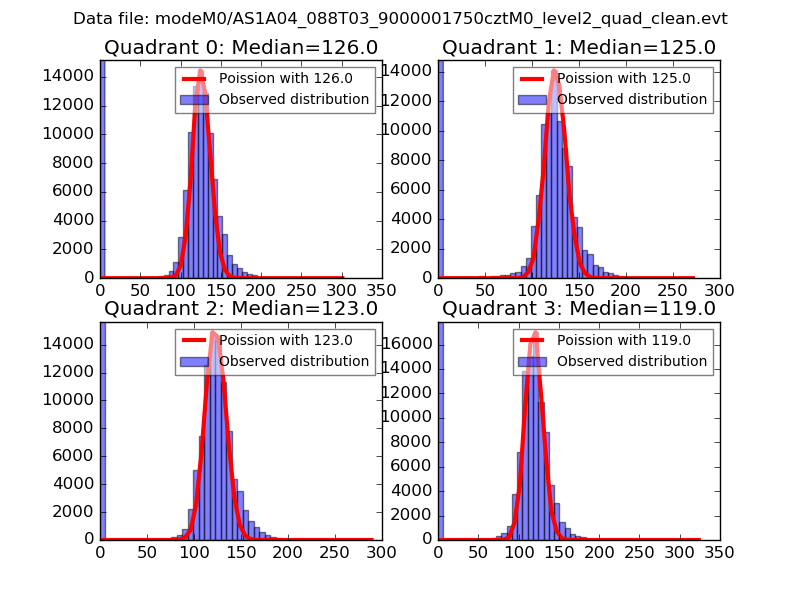 |
 |
| Quadrant-wise count rates Data is divided into 100 sec bins |
 |
|
| Module-wise count rates for Quadrant A Data is divided into 100 sec bins |
 |
 |
| Module-wise count rates for Quadrant B Data is divided into 100 sec bins |
 |
 |
| Module-wise count rates for Quadrant C Data is divided into 100 sec bins |
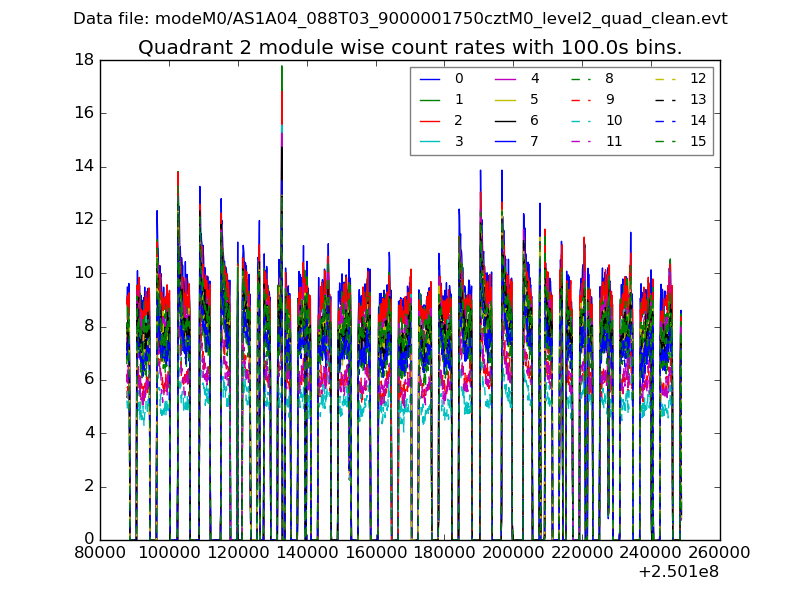 |
 |
| Module-wise count rates for Quadrant D Data is divided into 100 sec bins |
 |
 |
| Parameter | Plot |
|---|---|
| CZT HV Monitor |  |
| D_VDD |  |
| Temperature 1 | 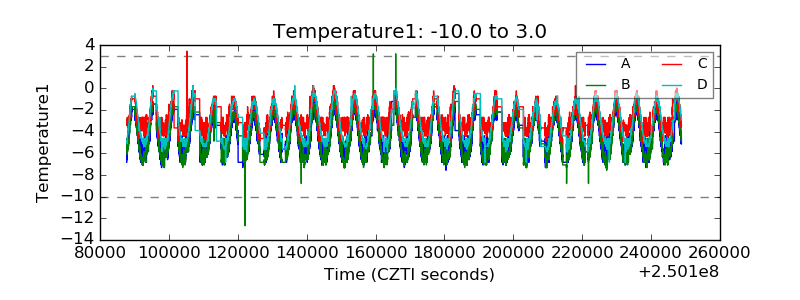 |
| Veto HV Monitor |  |
| Veto LLD |  |
| Alpha Counter |  |
| _CPM_Rate | 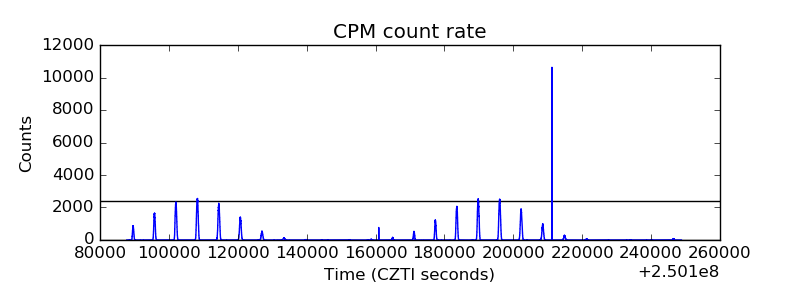 |
| CZT Counter |  |
| +2.5 Volts monitor |  |
| +5 Volts monitor |  |
| _ROLL_ROT |  |
| _Roll_DEC |  |
| _Roll_RA |  |
| Veto Counter |  |