| Param | Original file | Final file |
|---|---|---|
| Filename | modeM0/AS1A04_022T07_9000001748cztM0_level2_bc.evt | modeM0/AS1A04_022T07_9000001748cztM0_level2_quad_clean.evt |
| Size (bytes) | 4,337,861,760 | 919,434,240 |
| Size | 4.0 GB | 876.8 MB |
| Events in quadrant A | 15,816,809 | 6,089,180 |
| Events in quadrant B | 70,708,538 | 4,574,268 |
| Events in quadrant C | 15,060,168 | 6,124,849 |
| Events in quadrant D | 24,587,428 | 5,816,423 |
| Mode M0 | |||
|---|---|---|---|
| Quadrant | BADHDUFLAG | Total packets | Discarded packets |
| A | 0 | 163062 | 0 |
| B | 0 | 367229 | 0 |
| C | 0 | 156659 | 0 |
| D | 0 | 188708 | 0 |
| Mode M9 | |||
|---|---|---|---|
| Quadrant | BADHDUFLAG | Total packets | Discarded packets |
| A | 0 | 111 | 0 |
| B | 0 | 111 | 0 |
| C | 0 | 111 | 0 |
| D | 0 | 111 | 0 |
| Mode SS | |||
|---|---|---|---|
| Quadrant | BADHDUFLAG | Total packets | Discarded packets |
| A | 0 | 1558 | 0 |
| B | 0 | 1558 | 0 |
| C | 0 | 1558 | 0 |
| D | 0 | 1558 | 0 |
| Quadrant | Total seconds | Saturated seconds | Saturation percentage |
|---|---|---|---|
| A | 76340 | 1334 | 1.747446% |
| B | 76332 | 29073 | 38.087565% |
| C | 76340 | 668 | 0.875033% |
| D | 76332 | 2150 | 2.816643% |
Noise dominated data is calculated using 1-second bins in cleaned event files. If a bin has >2000 counts, and if more than 50% of those come from <1% of pixels, then it is considered to be noise-dominated and hence unusable.
| Quadrant | # 1 sec bins | Bins with >0 counts | Bins with >2000 counts | High rate bins dominated by noise | Noise dominated (total time) | Noise dominated (detector-on time) | Marked lightcurve |
|---|---|---|---|---|---|---|---|
| A | 87671 | 76350 | 0 | 0 | 0.00% | 0.00% | 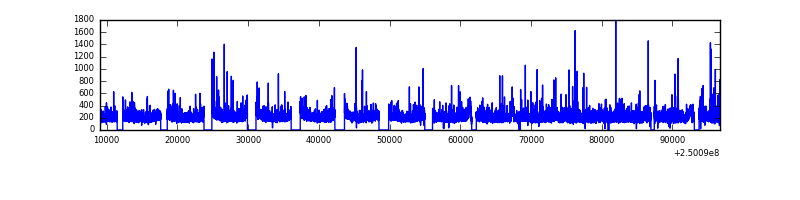 |
| B | 87671 | 76347 | 9652 | 9652 | 11.01% | 12.64% |  |
| C | 87671 | 76348 | 0 | 0 | 0.00% | 0.00% |  |
| D | 87671 | 76345 | 248 | 248 | 0.28% | 0.32% |  |
Top three noisy pixels from each quadrant. If the there are fewer than three noisy pixels in the level2.evt file, extra rows are filled as -1
| Pixel properties | Quadrant properties | ||||||
|---|---|---|---|---|---|---|---|
| Quadrant | DetID | PixID | Counts | Sigma | Mean | Median | Sigma |
| A | 1 | 162 | 588354 | 699.38 | 3834 | 3760 | 835.9 |
| A | 13 | 251 | 153366 | 178.98 | 3834 | 3760 | 835.9 |
| A | 13 | 254 | 87697 | 100.42 | 3834 | 3760 | 835.9 |
| B | 10 | 16 | 49428258 | 85860.11 | 3014 | 2936 | 575.6 |
| B | 4 | 239 | 4128983 | 7167.64 | 3014 | 2936 | 575.6 |
| B | 3 | 64 | 2610629 | 4530.0 | 3014 | 2936 | 575.6 |
| C | 7 | 238 | 44810 | 47.3 | 3816 | 3751 | 868.1 |
| C | 13 | 61 | 22887 | 22.04 | 3816 | 3751 | 868.1 |
| C | 8 | 222 | 21547 | 20.5 | 3816 | 3751 | 868.1 |
| D | 1 | 52 | 2895822 | 3106.19 | 3798 | 3642 | 931.1 |
| D | 12 | 233 | 1470888 | 1575.82 | 3798 | 3642 | 931.1 |
| D | 13 | 122 | 875280 | 936.14 | 3798 | 3642 | 931.1 |
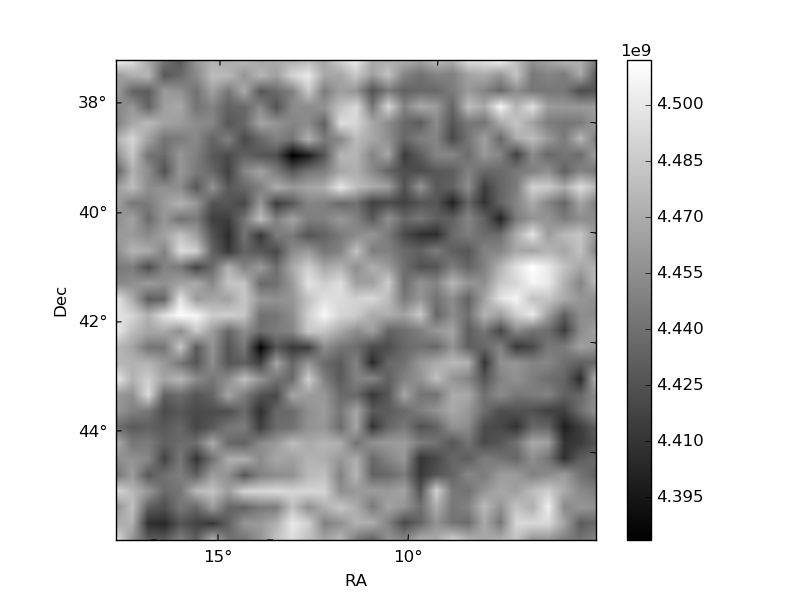
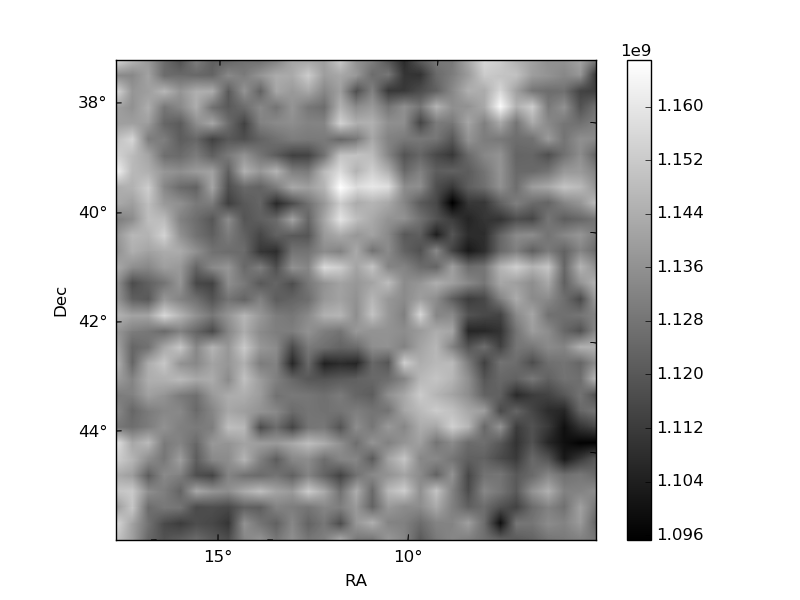
Histogram calculated using DETX and DETY for each event in the final _common_clean file
| Quadrant A |  |
 |
Quadrant B |
|---|---|---|---|
| Quadrant D |  |
 |
Quadrant C |
| Plot type | Count rate plots | Images |
|---|---|---|
| Comparison with Poisson distribution Blue bars denote a histogram of data divided into 1 sec bins. Red curve is a Poisson curve with rate = median count rate of data. |
 |
 |
| Quadrant-wise count rates Data is divided into 100 sec bins |
 |
|
| Module-wise count rates for Quadrant A Data is divided into 100 sec bins |
 |
 |
| Module-wise count rates for Quadrant B Data is divided into 100 sec bins |
 |
 |
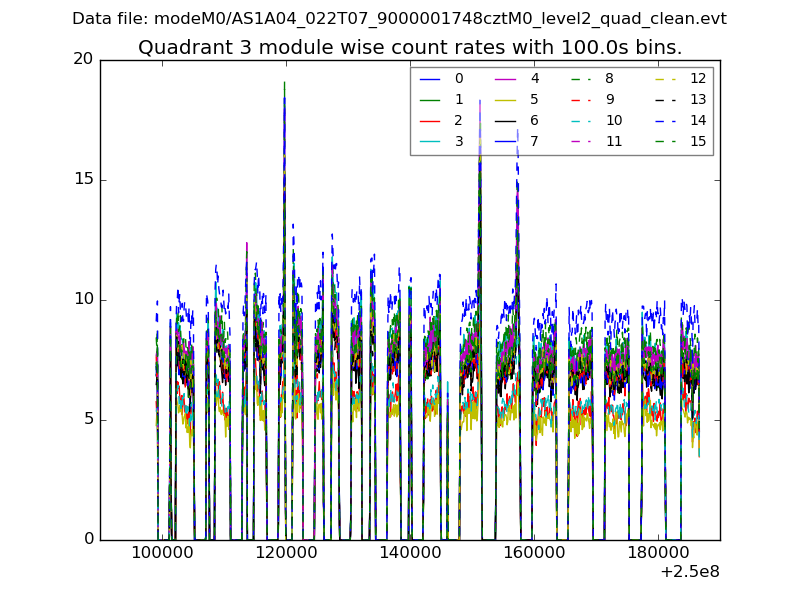
| Module-wise count rates for Quadrant C Data is divided into 100 sec bins |
 |
 |
| Module-wise count rates for Quadrant D Data is divided into 100 sec bins |
 |
 |
| Parameter | Plot |
|---|---|
| CZT HV Monitor |  |
| D_VDD |  |
| Temperature 1 |  |
| Veto HV Monitor |  |
| Veto LLD |  |
| Alpha Counter |  |
| _CPM_Rate |  |
| CZT Counter |  |
| +2.5 Volts monitor |  |
| +5 Volts monitor |  |
| _ROLL_ROT |  |
| _Roll_DEC | 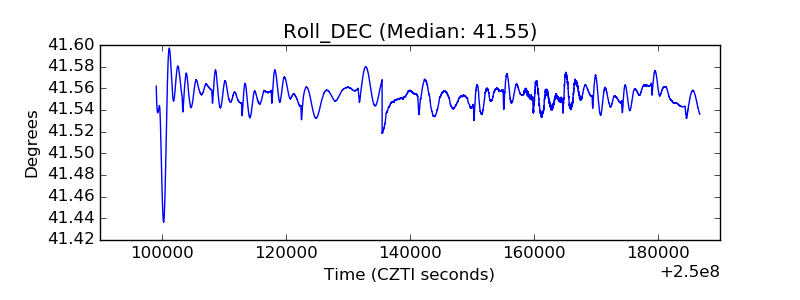 |
| _Roll_RA |  |
| Veto Counter |  |