| Param | Original file | Final file |
|---|---|---|
| Filename | modeM0/AS1G08_058T09_9000001744cztM0_level2_bc.evt | modeM0/AS1G08_058T09_9000001744cztM0_level2_quad_clean.evt |
| Size (bytes) | 3,505,821,120 | 969,949,440 |
| Size | 3.3 GB | 925.0 MB |
| Events in quadrant A | 22,034,849 | 6,003,429 |
| Events in quadrant B | 39,023,438 | 5,811,316 |
| Events in quadrant C | 16,299,428 | 6,104,512 |
| Events in quadrant D | 23,215,979 | 5,816,797 |
| Mode M9 | |||
|---|---|---|---|
| Quadrant | BADHDUFLAG | Total packets | Discarded packets |
| A | 0 | 118 | 0 |
| B | 0 | 118 | 0 |
| C | 0 | 118 | 0 |
| D | 0 | 118 | 0 |
| Mode SS | |||
|---|---|---|---|
| Quadrant | BADHDUFLAG | Total packets | Discarded packets |
| A | 0 | 1672 | 0 |
| B | 0 | 1672 | 0 |
| C | 0 | 1672 | 0 |
| D | 0 | 1672 | 0 |
| Mode M0 | |||
|---|---|---|---|
| Quadrant | BADHDUFLAG | Total packets | Discarded packets |
| A | 0 | 193338 | 0 |
| B | 0 | 251265 | 0 |
| C | 0 | 169070 | 0 |
| D | 0 | 192265 | 0 |
| Quadrant | Total seconds | Saturated seconds | Saturation percentage |
|---|---|---|---|
| A | 82285 | 1731 | 2.103664% |
| B | 82285 | 6843 | 8.316218% |
| C | 82285 | 671 | 0.815458% |
| D | 82285 | 2028 | 2.464605% |
Noise dominated data is calculated using 1-second bins in cleaned event files. If a bin has >2000 counts, and if more than 50% of those come from <1% of pixels, then it is considered to be noise-dominated and hence unusable.
| Quadrant | # 1 sec bins | Bins with >0 counts | Bins with >2000 counts | High rate bins dominated by noise | Noise dominated (total time) | Noise dominated (detector-on time) | Marked lightcurve |
|---|---|---|---|---|---|---|---|
| A | 94046 | 82291 | 0 | 0 | 0.00% | 0.00% |  |
| B | 94046 | 82285 | 843 | 843 | 0.90% | 1.02% | 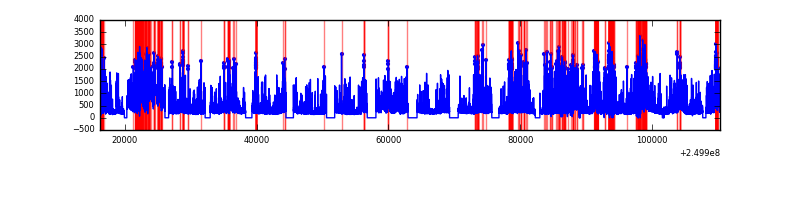 |
| C | 94046 | 82289 | 1 | 1 | 0.00% | 0.00% | 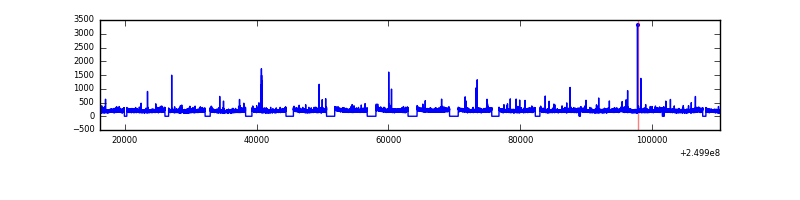 |
| D | 94046 | 82287 | 171 | 171 | 0.18% | 0.21% |  |
Top three noisy pixels from each quadrant. If the there are fewer than three noisy pixels in the level2.evt file, extra rows are filled as -1
| Pixel properties | Quadrant properties | ||||||
|---|---|---|---|---|---|---|---|
| Quadrant | DetID | PixID | Counts | Sigma | Mean | Median | Sigma |
| A | 8 | 15 | 4822556 | 5340.7 | 4139 | 4050 | 902.2 |
| A | 1 | 162 | 756070 | 833.52 | 4139 | 4050 | 902.2 |
| A | 13 | 251 | 118188 | 126.51 | 4139 | 4050 | 902.2 |
| B | 10 | 16 | 10657191 | 13779.27 | 4082 | 3967 | 773.1 |
| B | 3 | 64 | 5368721 | 6938.97 | 4082 | 3967 | 773.1 |
| B | 4 | 239 | 4239013 | 5477.76 | 4082 | 3967 | 773.1 |
| C | 1 | 3 | 42849 | 42.67 | 4132 | 4081 | 908.5 |
| C | 7 | 238 | 33070 | 31.91 | 4132 | 4081 | 908.5 |
| C | 14 | 234 | 29078 | 27.51 | 4132 | 4081 | 908.5 |
| D | 1 | 52 | 2469056 | 2483.77 | 4102 | 3951 | 992.5 |
| D | 5 | 222 | 1139160 | 1143.8 | 4102 | 3951 | 992.5 |
| D | 9 | 85 | 979081 | 982.51 | 4102 | 3951 | 992.5 |
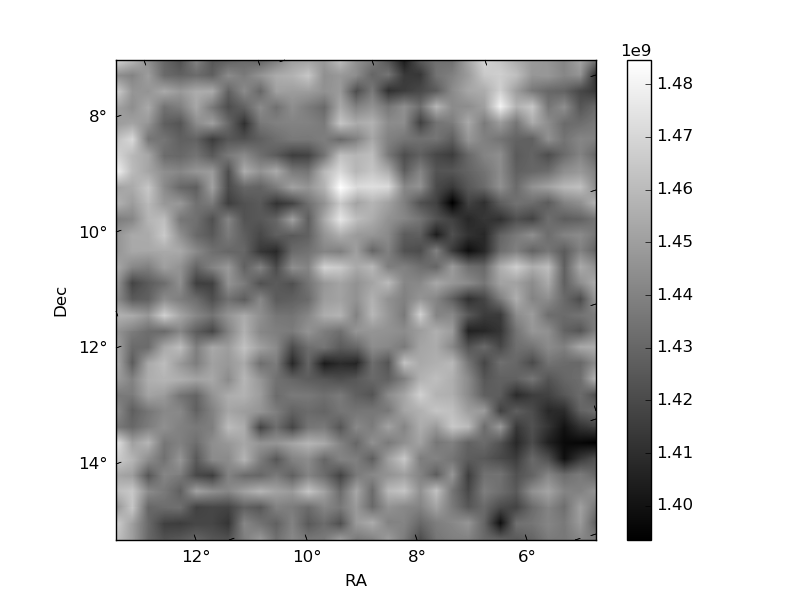
Histogram calculated using DETX and DETY for each event in the final _common_clean file
| Quadrant A | 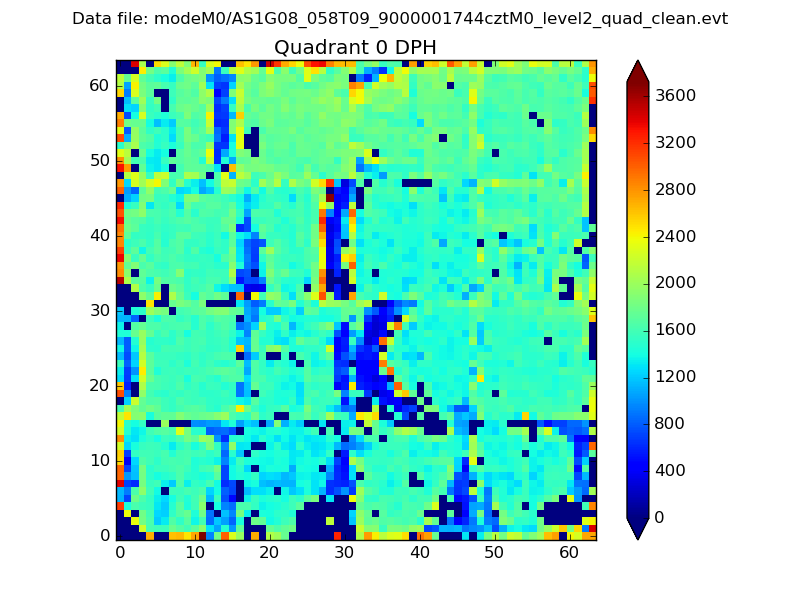 |
 |
Quadrant B |
|---|---|---|---|
| Quadrant D | 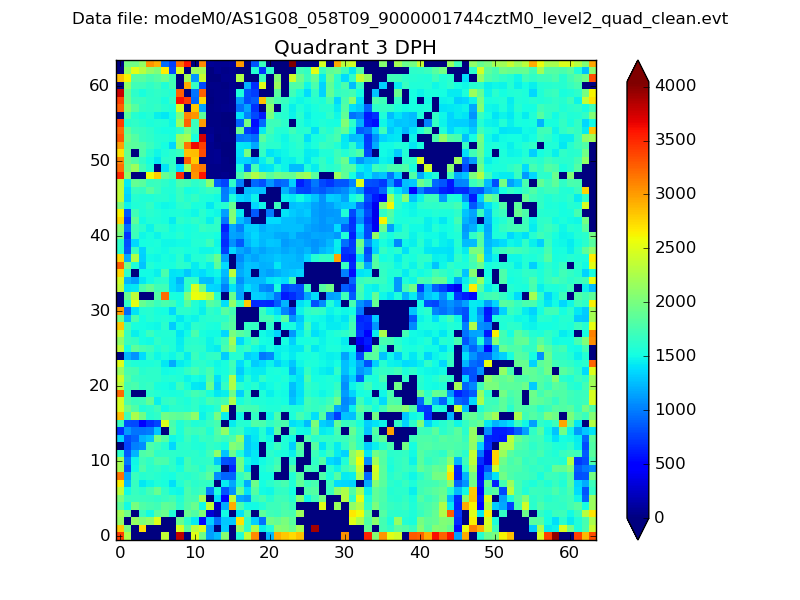 |
 |
Quadrant C |
| Plot type | Count rate plots | Images |
|---|---|---|
| Comparison with Poisson distribution Blue bars denote a histogram of data divided into 1 sec bins. Red curve is a Poisson curve with rate = median count rate of data. |
 |
 |
| Quadrant-wise count rates Data is divided into 100 sec bins |
 |
|
| Module-wise count rates for Quadrant A Data is divided into 100 sec bins |
 |
 |
| Module-wise count rates for Quadrant B Data is divided into 100 sec bins |
 |
 |
| Module-wise count rates for Quadrant C Data is divided into 100 sec bins |
 |
 |
| Module-wise count rates for Quadrant D Data is divided into 100 sec bins |
 |
 |
| Parameter | Plot |
|---|---|
| CZT HV Monitor |  |
| D_VDD |  |
| Temperature 1 | 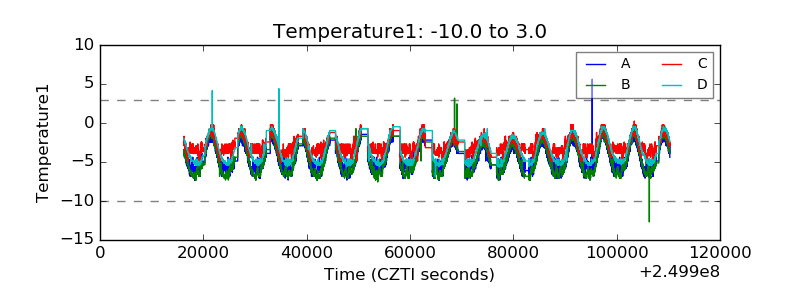 |
| Veto HV Monitor |  |
| Veto LLD |  |
| Alpha Counter |  |
| _CPM_Rate |  |
| CZT Counter |  |
| +2.5 Volts monitor | 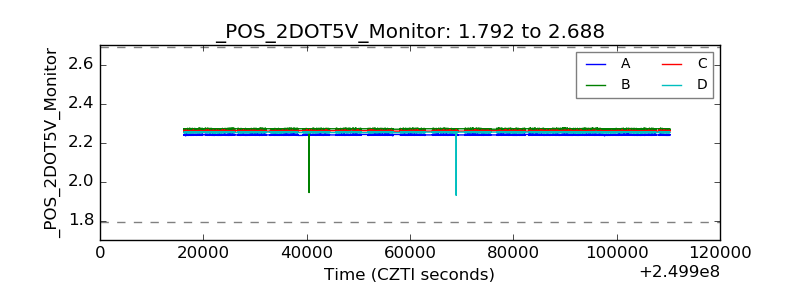 |
| +5 Volts monitor |  |
| _ROLL_ROT |  |
| _Roll_DEC | 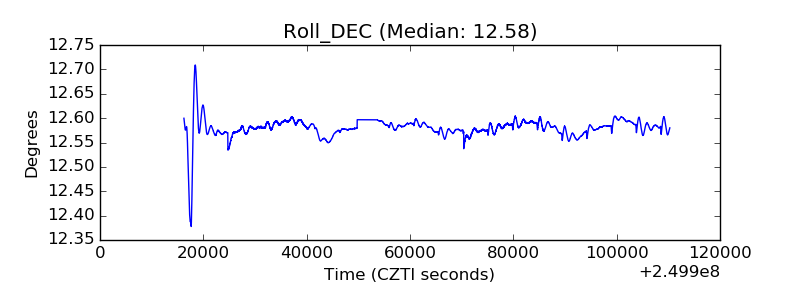 |
| _Roll_RA | 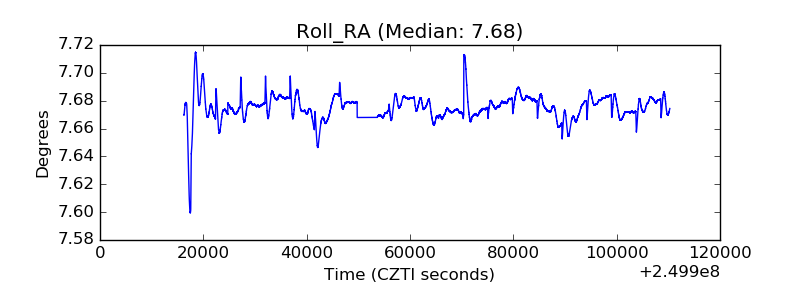 |
| Veto Counter |  |