| Param | Original file | Final file |
|---|---|---|
| Filename | modeM0/AS1C03_024T01_9000001742cztM0_level2_bc.evt | modeM0/AS1C03_024T01_9000001742cztM0_level2_quad_clean.evt |
| Size (bytes) | 3,675,666,240 | 877,196,160 |
| Size | 3.4 GB | 836.6 MB |
| Events in quadrant A | 18,973,583 | 5,498,613 |
| Events in quadrant B | 45,765,293 | 5,266,993 |
| Events in quadrant C | 14,462,806 | 5,600,036 |
| Events in quadrant D | 27,172,663 | 5,214,778 |
| Mode M9 | |||
|---|---|---|---|
| Quadrant | BADHDUFLAG | Total packets | Discarded packets |
| A | 0 | 112 | 0 |
| B | 0 | 112 | 0 |
| C | 0 | 112 | 0 |
| D | 0 | 112 | 0 |
| Mode M0 | |||
|---|---|---|---|
| Quadrant | BADHDUFLAG | Total packets | Discarded packets |
| A | 0 | 170693 | 0 |
| B | 0 | 255225 | 0 |
| C | 0 | 149983 | 0 |
| D | 0 | 196783 | 0 |
| Mode SS | |||
|---|---|---|---|
| Quadrant | BADHDUFLAG | Total packets | Discarded packets |
| A | 0 | 1476 | 0 |
| B | 0 | 1476 | 0 |
| C | 0 | 1474 | 0 |
| D | 0 | 1476 | 0 |
| Quadrant | Total seconds | Saturated seconds | Saturation percentage |
|---|---|---|---|
| A | 72695 | 2055 | 2.826879% |
| B | 72725 | 8513 | 11.705741% |
| C | 72717 | 565 | 0.776985% |
| D | 72724 | 3497 | 4.808591% |
Noise dominated data is calculated using 1-second bins in cleaned event files. If a bin has >2000 counts, and if more than 50% of those come from <1% of pixels, then it is considered to be noise-dominated and hence unusable.
| Quadrant | # 1 sec bins | Bins with >0 counts | Bins with >2000 counts | High rate bins dominated by noise | Noise dominated (total time) | Noise dominated (detector-on time) | Marked lightcurve |
|---|---|---|---|---|---|---|---|
| A | 84074 | 72716 | 23 | 23 | 0.03% | 0.03% |  |
| B | 84074 | 72756 | 1261 | 1261 | 1.50% | 1.73% |  |
| C | 84074 | 72746 | 2 | 2 | 0.00% | 0.00% | 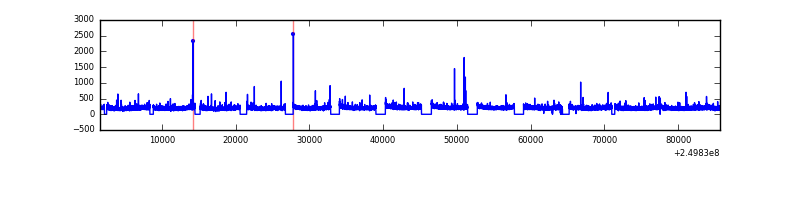 |
| D | 84074 | 72749 | 451 | 451 | 0.54% | 0.62% |  |
Top three noisy pixels from each quadrant. If the there are fewer than three noisy pixels in the level2.evt file, extra rows are filled as -1
| Pixel properties | Quadrant properties | ||||||
|---|---|---|---|---|---|---|---|
| Quadrant | DetID | PixID | Counts | Sigma | Mean | Median | Sigma |
| A | 8 | 15 | 2634262 | 3283.94 | 3682 | 3609 | 801.1 |
| A | 5 | 16 | 895244 | 1113.06 | 3682 | 3609 | 801.1 |
| A | 1 | 162 | 581721 | 721.68 | 3682 | 3609 | 801.1 |
| B | 10 | 16 | 23318233 | 33991.09 | 3627 | 3525 | 685.9 |
| B | 4 | 239 | 4022489 | 5859.35 | 3627 | 3525 | 685.9 |
| B | 3 | 64 | 1671942 | 2432.43 | 3627 | 3525 | 685.9 |
| C | 14 | 234 | 50594 | 58.44 | 3669 | 3621 | 803.8 |
| C | 1 | 3 | 29550 | 32.26 | 3669 | 3621 | 803.8 |
| C | 13 | 61 | 22240 | 23.16 | 3669 | 3621 | 803.8 |
| D | 1 | 52 | 7683357 | 9203.74 | 3603 | 3474 | 834.4 |
| D | 13 | 137 | 1504478 | 1798.83 | 3603 | 3474 | 834.4 |
| D | 8 | 195 | 1138576 | 1360.33 | 3603 | 3474 | 834.4 |
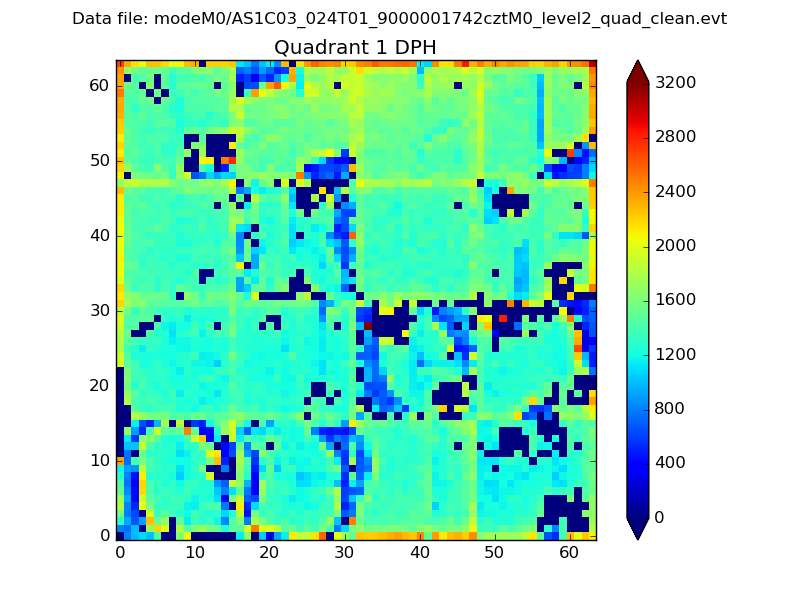
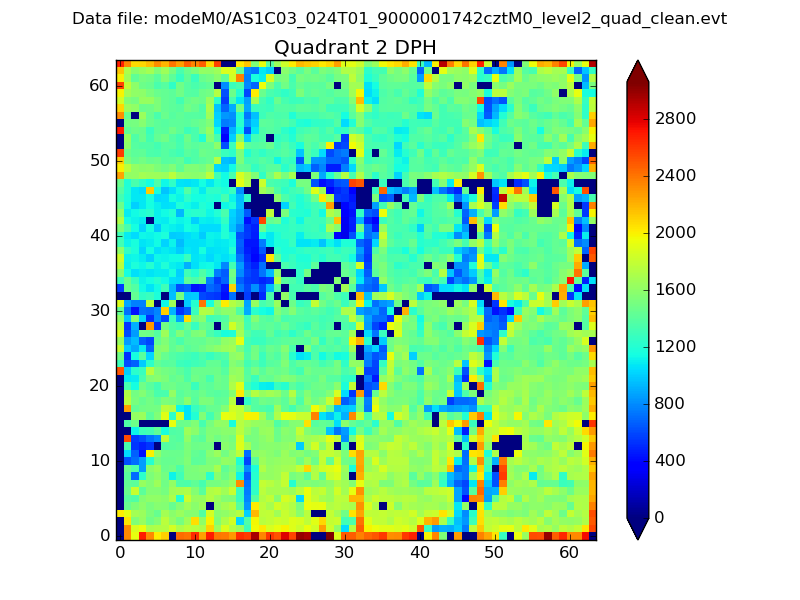
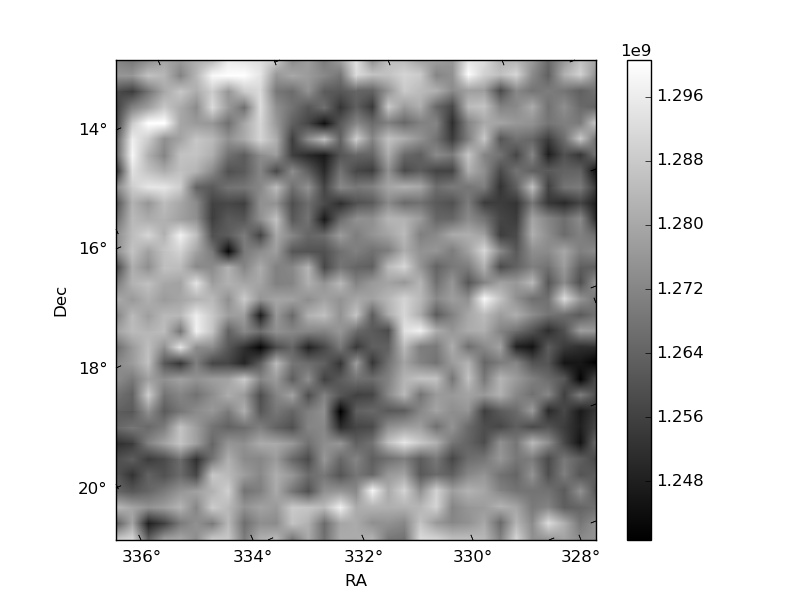
Histogram calculated using DETX and DETY for each event in the final _common_clean file
| Quadrant A |  |
 |
Quadrant B |
|---|---|---|---|
| Quadrant D |  |
 |
Quadrant C |
| Plot type | Count rate plots | Images |
|---|---|---|
| Comparison with Poisson distribution Blue bars denote a histogram of data divided into 1 sec bins. Red curve is a Poisson curve with rate = median count rate of data. |
 |
 |
| Quadrant-wise count rates Data is divided into 100 sec bins |
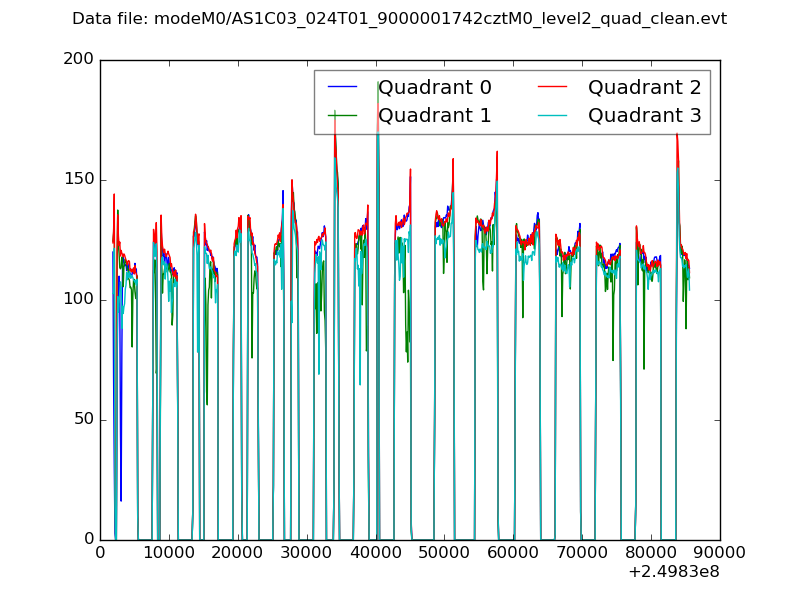 |
|
| Module-wise count rates for Quadrant A Data is divided into 100 sec bins |
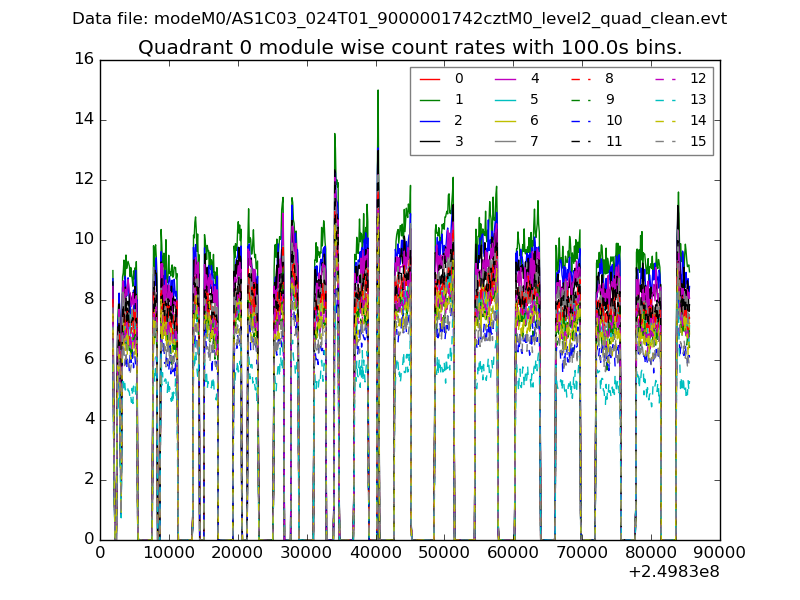 |
 |
| Module-wise count rates for Quadrant B Data is divided into 100 sec bins |
 |
 |
| Module-wise count rates for Quadrant C Data is divided into 100 sec bins |
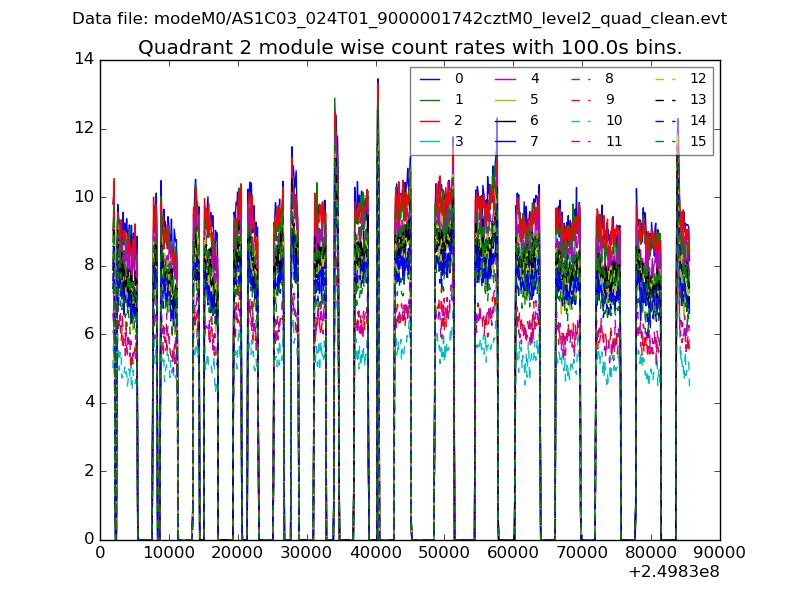 |
 |
| Module-wise count rates for Quadrant D Data is divided into 100 sec bins |
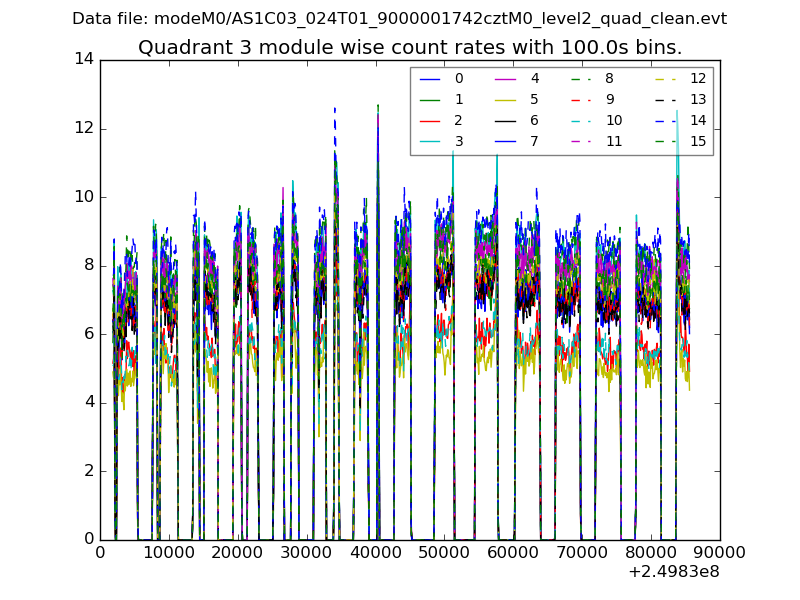 |
 |
| Parameter | Plot |
|---|---|
| CZT HV Monitor |  |
| D_VDD |  |
| Temperature 1 |  |
| Veto HV Monitor |  |
| Veto LLD |  |
| Alpha Counter |  |
| _CPM_Rate |  |
| CZT Counter | 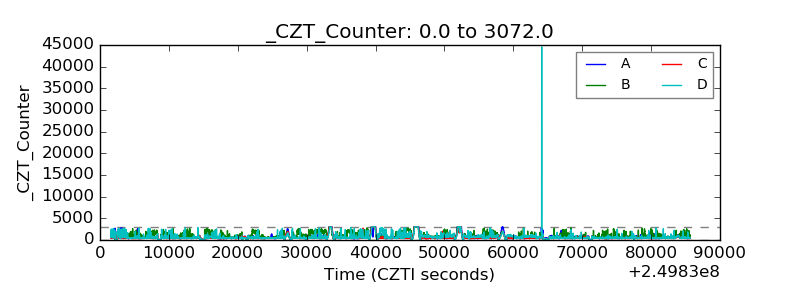 |
| +2.5 Volts monitor |  |
| +5 Volts monitor |  |
| _ROLL_ROT |  |
| _Roll_DEC |  |
| _Roll_RA | 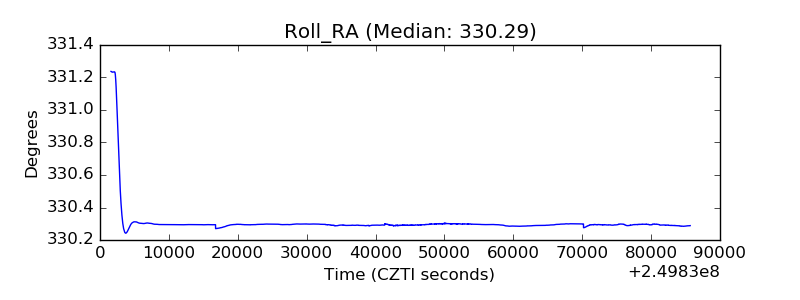 |
| Veto Counter |  |