| Param | Original file | Final file |
|---|---|---|
| Filename | modeM0/AS1A04_231T01_9000001740cztM0_level2_bc.evt | modeM0/AS1A04_231T01_9000001740cztM0_level2_quad_clean.evt |
| Size (bytes) | 3,350,355,840 | 789,243,840 |
| Size | 3.1 GB | 752.7 MB |
| Events in quadrant A | 16,469,542 | 5,155,195 |
| Events in quadrant B | 37,945,229 | 5,008,431 |
| Events in quadrant C | 11,174,593 | 5,305,943 |
| Events in quadrant D | 32,102,273 | 4,622,357 |
| Mode M0 | |||
|---|---|---|---|
| Quadrant | BADHDUFLAG | Total packets | Discarded packets |
| A | 0 | 136978 | 0 |
| B | 0 | 204546 | 0 |
| C | 0 | 114074 | 0 |
| D | 0 | 193703 | 0 |
| Mode SS | |||
|---|---|---|---|
| Quadrant | BADHDUFLAG | Total packets | Discarded packets |
| A | 0 | 1130 | 0 |
| B | 0 | 1130 | 0 |
| C | 0 | 1130 | 0 |
| D | 0 | 1130 | 0 |
| Mode M9 | |||
|---|---|---|---|
| Quadrant | BADHDUFLAG | Total packets | Discarded packets |
| A | 0 | 89 | 0 |
| B | 0 | 89 | 0 |
| C | 0 | 89 | 0 |
| D | 0 | 89 | 0 |
| Quadrant | Total seconds | Saturated seconds | Saturation percentage |
|---|---|---|---|
| A | 55506 | 1832 | 3.300544% |
| B | 55506 | 8971 | 16.162217% |
| C | 55506 | 616 | 1.109790% |
| D | 55506 | 8281 | 14.919108% |
Noise dominated data is calculated using 1-second bins in cleaned event files. If a bin has >2000 counts, and if more than 50% of those come from <1% of pixels, then it is considered to be noise-dominated and hence unusable.
| Quadrant | # 1 sec bins | Bins with >0 counts | Bins with >2000 counts | High rate bins dominated by noise | Noise dominated (total time) | Noise dominated (detector-on time) | Marked lightcurve |
|---|---|---|---|---|---|---|---|
| A | 64642 | 55509 | 62 | 62 | 0.10% | 0.11% |  |
| B | 64642 | 55506 | 1320 | 1320 | 2.04% | 2.38% |  |
| C | 64642 | 55512 | 3 | 3 | 0.00% | 0.01% | 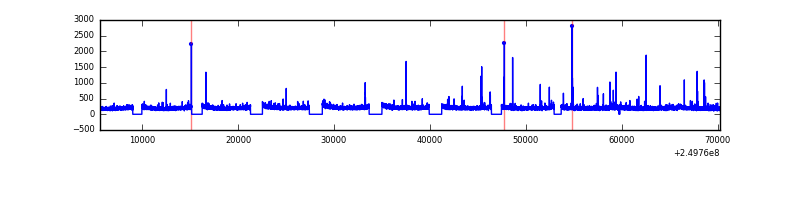 |
| D | 64642 | 55507 | 2069 | 2069 | 3.20% | 3.73% |  |
Top three noisy pixels from each quadrant. If the there are fewer than three noisy pixels in the level2.evt file, extra rows are filled as -1
| Pixel properties | Quadrant properties | ||||||
|---|---|---|---|---|---|---|---|
| Quadrant | DetID | PixID | Counts | Sigma | Mean | Median | Sigma |
| A | 8 | 15 | 3891837 | 6448.84 | 2769 | 2710 | 603.1 |
| A | 5 | 16 | 607007 | 1002.03 | 2769 | 2710 | 603.1 |
| A | 1 | 162 | 538311 | 888.12 | 2769 | 2710 | 603.1 |
| B | 10 | 16 | 18119255 | 35031.38 | 2713 | 2646 | 517.2 |
| B | 4 | 239 | 3553752 | 6866.64 | 2713 | 2646 | 517.2 |
| B | 15 | 204 | 2645971 | 5111.29 | 2713 | 2646 | 517.2 |
| C | 14 | 234 | 50960 | 77.67 | 2815 | 2778 | 620.4 |
| C | 12 | 4 | 23391 | 33.23 | 2815 | 2778 | 620.4 |
| C | 8 | 128 | 22102 | 31.15 | 2815 | 2778 | 620.4 |
| D | 1 | 52 | 14722984 | 24095.64 | 2610 | 2515 | 610.9 |
| D | 13 | 137 | 3520807 | 5759.02 | 2610 | 2515 | 610.9 |
| D | 10 | 199 | 595745 | 971.05 | 2610 | 2515 | 610.9 |
Histogram calculated using DETX and DETY for each event in the final _common_clean file
| Quadrant A |  |
 |
Quadrant B |
|---|---|---|---|
| Quadrant D |  |
 |
Quadrant C |
| Plot type | Count rate plots | Images |
|---|---|---|
| Comparison with Poisson distribution Blue bars denote a histogram of data divided into 1 sec bins. Red curve is a Poisson curve with rate = median count rate of data. |
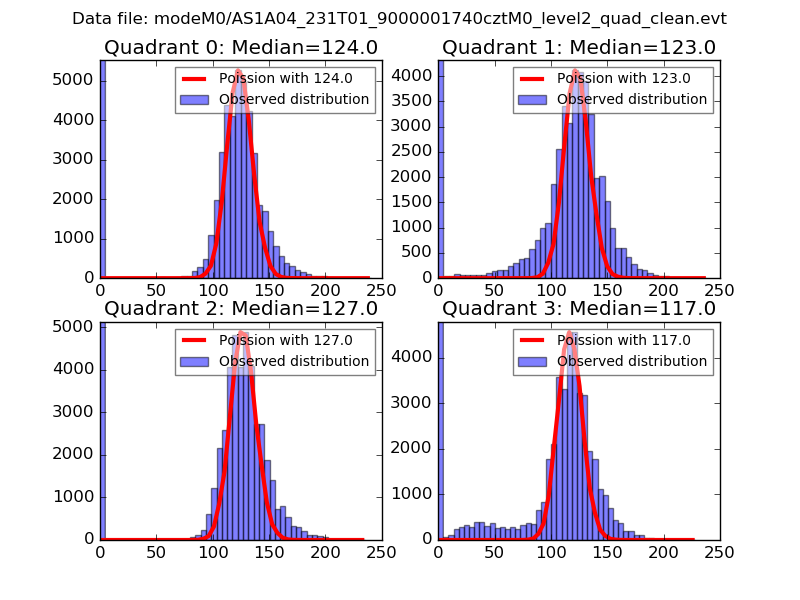 |
 |
| Quadrant-wise count rates Data is divided into 100 sec bins |
 |
|
| Module-wise count rates for Quadrant A Data is divided into 100 sec bins |
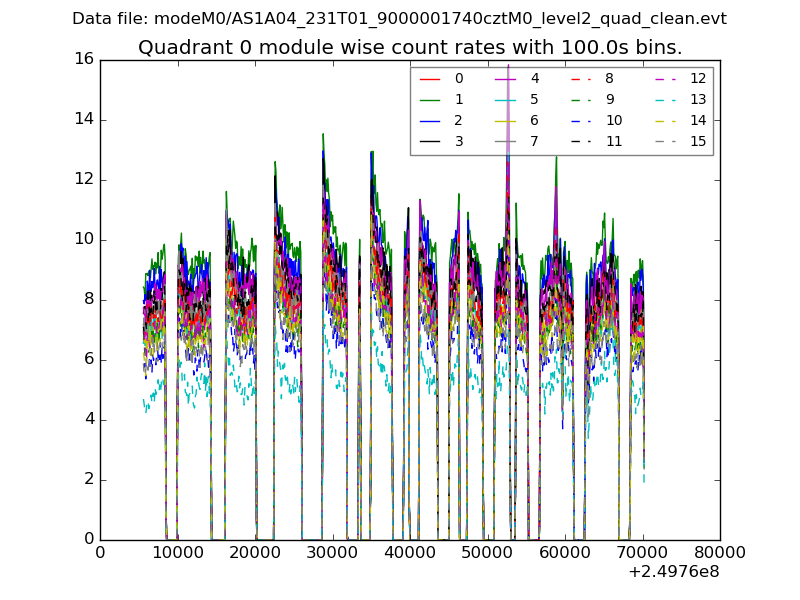 |
 |
| Module-wise count rates for Quadrant B Data is divided into 100 sec bins |
 |
 |
| Module-wise count rates for Quadrant C Data is divided into 100 sec bins |
 |
 |
| Module-wise count rates for Quadrant D Data is divided into 100 sec bins |
 |
 |
| Parameter | Plot |
|---|---|
| CZT HV Monitor |  |
| D_VDD |  |
| Temperature 1 |  |
| Veto HV Monitor | 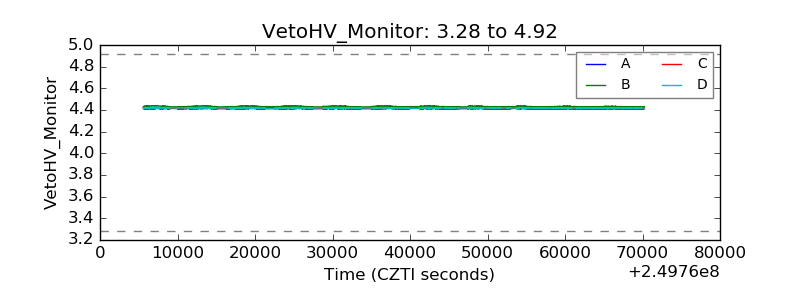 |
| Veto LLD |  |
| Alpha Counter | 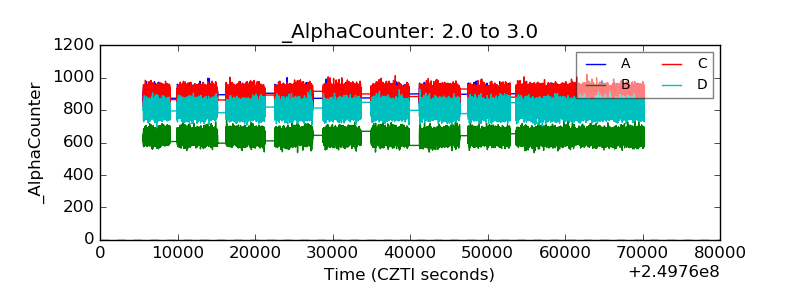 |
| _CPM_Rate |  |
| CZT Counter |  |
| +2.5 Volts monitor |  |
| +5 Volts monitor |  |
| _ROLL_ROT | 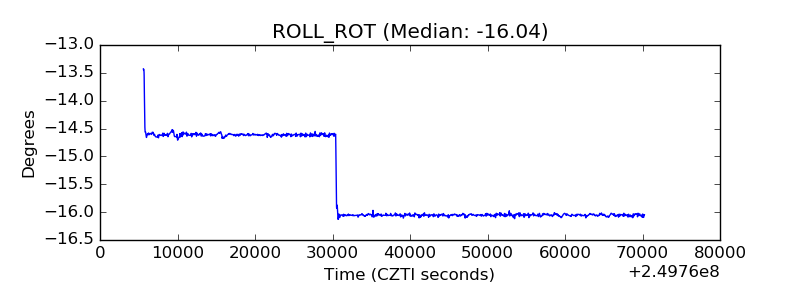 |
| _Roll_DEC |  |
| _Roll_RA |  |
| Veto Counter |  |