| Param | Original file | Final file |
|---|---|---|
| Filename | modeM0/AS1A04_113T03_9000001738cztM0_level2_bc.evt | modeM0/AS1A04_113T03_9000001738cztM0_level2_quad_clean.evt |
| Size (bytes) | 3,062,059,200 | 794,828,160 |
| Size | 2.9 GB | 758.0 MB |
| Events in quadrant A | 18,130,842 | 5,025,885 |
| Events in quadrant B | 23,053,045 | 4,943,248 |
| Events in quadrant C | 12,901,852 | 5,103,078 |
| Events in quadrant D | 34,291,975 | 4,608,510 |
| Mode SS | |||
|---|---|---|---|
| Quadrant | BADHDUFLAG | Total packets | Discarded packets |
| A | 0 | 1304 | 0 |
| B | 0 | 1304 | 0 |
| C | 0 | 1304 | 0 |
| D | 0 | 1304 | 0 |
| Mode M9 | |||
|---|---|---|---|
| Quadrant | BADHDUFLAG | Total packets | Discarded packets |
| A | 0 | 96 | 0 |
| B | 0 | 96 | 0 |
| C | 0 | 96 | 0 |
| D | 0 | 96 | 0 |
| Mode M0 | |||
|---|---|---|---|
| Quadrant | BADHDUFLAG | Total packets | Discarded packets |
| A | 0 | 156072 | 0 |
| B | 0 | 173330 | 0 |
| C | 0 | 132123 | 0 |
| D | 0 | 208231 | 0 |
| Quadrant | Total seconds | Saturated seconds | Saturation percentage |
|---|---|---|---|
| A | 64023 | 1333 | 2.082064% |
| B | 64023 | 3961 | 6.186839% |
| C | 64023 | 563 | 0.879371% |
| D | 64023 | 6402 | 9.999531% |
Noise dominated data is calculated using 1-second bins in cleaned event files. If a bin has >2000 counts, and if more than 50% of those come from <1% of pixels, then it is considered to be noise-dominated and hence unusable.
| Quadrant | # 1 sec bins | Bins with >0 counts | Bins with >2000 counts | High rate bins dominated by noise | Noise dominated (total time) | Noise dominated (detector-on time) | Marked lightcurve |
|---|---|---|---|---|---|---|---|
| A | 73618 | 64025 | 2 | 2 | 0.00% | 0.00% |  |
| B | 73618 | 64025 | 114 | 114 | 0.15% | 0.18% |  |
| C | 73618 | 64025 | 0 | 0 | 0.00% | 0.00% |  |
| D | 73618 | 64024 | 956 | 956 | 1.30% | 1.49% |  |
Top three noisy pixels from each quadrant. If the there are fewer than three noisy pixels in the level2.evt file, extra rows are filled as -1
| Pixel properties | Quadrant properties | ||||||
|---|---|---|---|---|---|---|---|
| Quadrant | DetID | PixID | Counts | Sigma | Mean | Median | Sigma |
| A | 8 | 15 | 3824723 | 5230.8 | 3319 | 3257 | 730.6 |
| A | 1 | 162 | 672009 | 915.38 | 3319 | 3257 | 730.6 |
| A | 6 | 16 | 278502 | 376.75 | 3319 | 3257 | 730.6 |
| B | 4 | 239 | 5204992 | 8334.21 | 3297 | 3217 | 624.1 |
| B | 3 | 64 | 2097545 | 3355.5 | 3297 | 3217 | 624.1 |
| B | 15 | 204 | 1389404 | 2220.93 | 3297 | 3217 | 624.1 |
| C | 12 | 4 | 24682 | 29.86 | 3285 | 3245 | 718.0 |
| C | 14 | 234 | 23737 | 28.54 | 3285 | 3245 | 718.0 |
| C | 13 | 61 | 20191 | 23.6 | 3285 | 3245 | 718.0 |
| D | 1 | 52 | 11278720 | 15187.37 | 3147 | 3030 | 742.4 |
| D | 8 | 195 | 4656087 | 6267.26 | 3147 | 3030 | 742.4 |
| D | 12 | 221 | 2791255 | 3755.5 | 3147 | 3030 | 742.4 |
Histogram calculated using DETX and DETY for each event in the final _common_clean file
| Quadrant A |  |
 |
Quadrant B |
|---|---|---|---|
| Quadrant D | 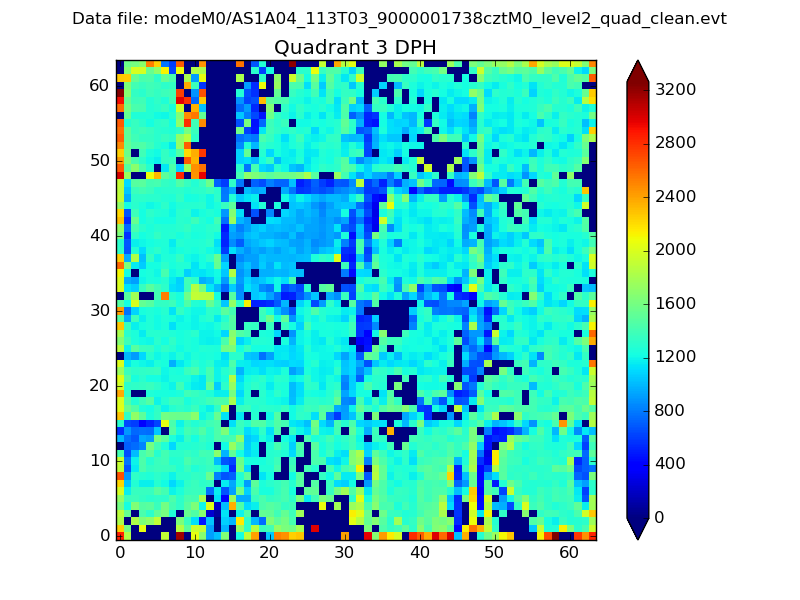 |
 |
Quadrant C |
| Plot type | Count rate plots | Images |
|---|---|---|
| Comparison with Poisson distribution Blue bars denote a histogram of data divided into 1 sec bins. Red curve is a Poisson curve with rate = median count rate of data. |
 |
 |
| Quadrant-wise count rates Data is divided into 100 sec bins |
 |
|
| Module-wise count rates for Quadrant A Data is divided into 100 sec bins |
 |
 |
| Module-wise count rates for Quadrant B Data is divided into 100 sec bins |
 |
 |
| Module-wise count rates for Quadrant C Data is divided into 100 sec bins |
 |
 |
| Module-wise count rates for Quadrant D Data is divided into 100 sec bins |
 |
 |
| Parameter | Plot |
|---|---|
| CZT HV Monitor |  |
| D_VDD |  |
| Temperature 1 | 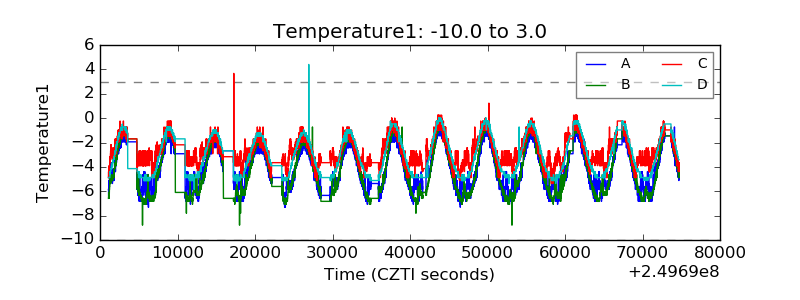 |
| Veto HV Monitor |  |
| Veto LLD |  |
| Alpha Counter |  |
| _CPM_Rate | 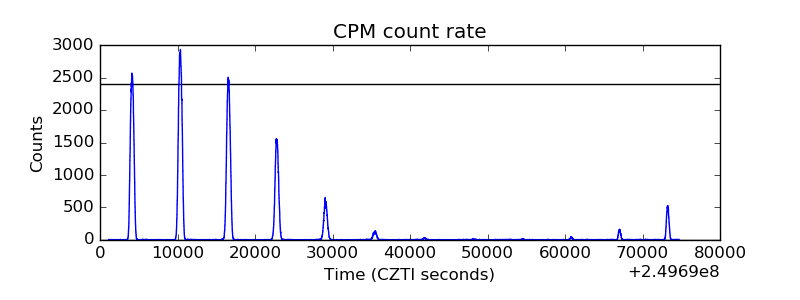 |
| CZT Counter |  |
| +2.5 Volts monitor |  |
| +5 Volts monitor |  |
| _ROLL_ROT |  |
| _Roll_DEC |  |
| _Roll_RA |  |
| Veto Counter | 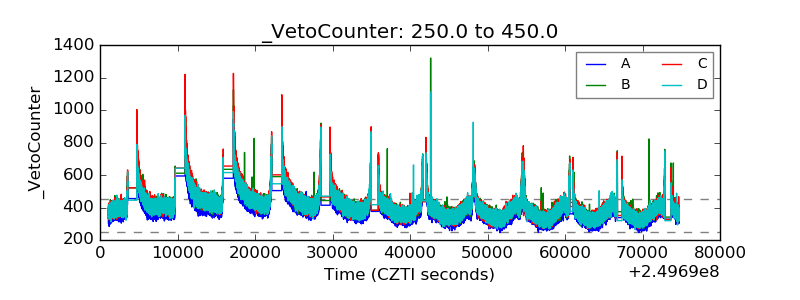 |