| Param | Original file | Final file |
|---|---|---|
| Filename | modeM0/AS1G08_006T03_9000001732cztM0_level2_bc.evt | modeM0/AS1G08_006T03_9000001732cztM0_level2_quad_clean.evt |
| Size (bytes) | 1,561,242,240 | 637,917,120 |
| Size | 1.5 GB | 608.4 MB |
| Events in quadrant A | 10,251,705 | 4,201,070 |
| Events in quadrant B | 14,406,239 | 4,186,882 |
| Events in quadrant C | 7,817,747 | 4,279,230 |
| Events in quadrant D | 12,202,899 | 4,033,218 |
| Mode M9 | |||
|---|---|---|---|
| Quadrant | BADHDUFLAG | Total packets | Discarded packets |
| A | 0 | 80 | 0 |
| B | 0 | 80 | 0 |
| C | 0 | 80 | 0 |
| D | 0 | 80 | 0 |
| Mode SS | |||
|---|---|---|---|
| Quadrant | BADHDUFLAG | Total packets | Discarded packets |
| A | 0 | 778 | 0 |
| B | 0 | 778 | 0 |
| C | 0 | 778 | 0 |
| D | 0 | 778 | 0 |
| Mode M0 | |||
|---|---|---|---|
| Quadrant | BADHDUFLAG | Total packets | Discarded packets |
| A | 0 | 89629 | 0 |
| B | 0 | 105459 | 0 |
| C | 0 | 77647 | 0 |
| D | 0 | 91623 | 0 |
| Quadrant | Total seconds | Saturated seconds | Saturation percentage |
|---|---|---|---|
| A | 38184 | 451 | 1.181123% |
| B | 38172 | 2428 | 6.360683% |
| C | 38185 | 102 | 0.267121% |
| D | 38177 | 581 | 1.521859% |
Noise dominated data is calculated using 1-second bins in cleaned event files. If a bin has >2000 counts, and if more than 50% of those come from <1% of pixels, then it is considered to be noise-dominated and hence unusable.
| Quadrant | # 1 sec bins | Bins with >0 counts | Bins with >2000 counts | High rate bins dominated by noise | Noise dominated (total time) | Noise dominated (detector-on time) | Marked lightcurve |
|---|---|---|---|---|---|---|---|
| A | 46289 | 38194 | 8 | 8 | 0.02% | 0.02% |  |
| B | 46289 | 38193 | 89 | 89 | 0.19% | 0.23% |  |
| C | 46289 | 38194 | 0 | 0 | 0.00% | 0.00% |  |
| D | 46289 | 38195 | 72 | 72 | 0.16% | 0.19% |  |
Top three noisy pixels from each quadrant. If the there are fewer than three noisy pixels in the level2.evt file, extra rows are filled as -1
| Pixel properties | Quadrant properties | ||||||
|---|---|---|---|---|---|---|---|
| Quadrant | DetID | PixID | Counts | Sigma | Mean | Median | Sigma |
| A | 8 | 15 | 1064284 | 2469.24 | 1997 | 1965 | 430.2 |
| A | 13 | 251 | 547823 | 1268.78 | 1997 | 1965 | 430.2 |
| A | 9 | 143 | 378698 | 875.67 | 1997 | 1965 | 430.2 |
| B | 4 | 239 | 2558639 | 6908.12 | 1991 | 1944 | 370.1 |
| B | 3 | 64 | 2067980 | 5582.37 | 1991 | 1944 | 370.1 |
| B | 15 | 204 | 1088082 | 2934.72 | 1991 | 1944 | 370.1 |
| C | 13 | 61 | 12054 | 23.13 | 1994 | 1976 | 435.8 |
| C | 12 | 4 | 11628 | 22.15 | 1994 | 1976 | 435.8 |
| C | 8 | 222 | 10806 | 20.26 | 1994 | 1976 | 435.8 |
| D | 8 | 195 | 2114510 | 4634.58 | 1976 | 1910 | 455.8 |
| D | 1 | 52 | 863492 | 1890.12 | 1976 | 1910 | 455.8 |
| D | 13 | 249 | 197945 | 430.06 | 1976 | 1910 | 455.8 |
Histogram calculated using DETX and DETY for each event in the final _common_clean file
| Quadrant A |  |
 |
Quadrant B |
|---|---|---|---|
| Quadrant D |  |
 |
Quadrant C |
| Plot type | Count rate plots | Images |
|---|---|---|
| Comparison with Poisson distribution Blue bars denote a histogram of data divided into 1 sec bins. Red curve is a Poisson curve with rate = median count rate of data. |
 |
 |
| Quadrant-wise count rates Data is divided into 100 sec bins |
 |
|
| Module-wise count rates for Quadrant A Data is divided into 100 sec bins |
 |
 |
| Module-wise count rates for Quadrant B Data is divided into 100 sec bins |
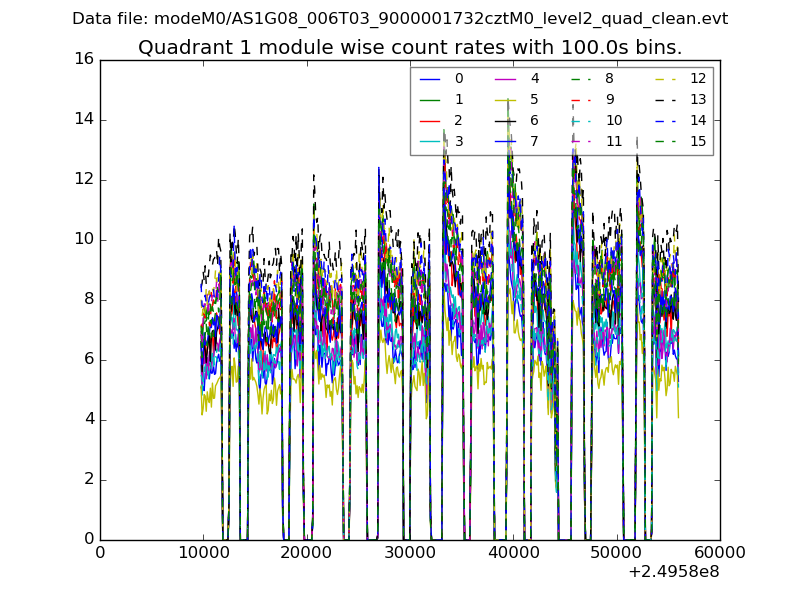 |
 |
| Module-wise count rates for Quadrant C Data is divided into 100 sec bins |
 |
 |
| Module-wise count rates for Quadrant D Data is divided into 100 sec bins |
 |
 |
| Parameter | Plot |
|---|---|
| CZT HV Monitor |  |
| D_VDD |  |
| Temperature 1 |  |
| Veto HV Monitor |  |
| Veto LLD |  |
| Alpha Counter |  |
| _CPM_Rate |  |
| CZT Counter |  |
| +2.5 Volts monitor |  |
| +5 Volts monitor | 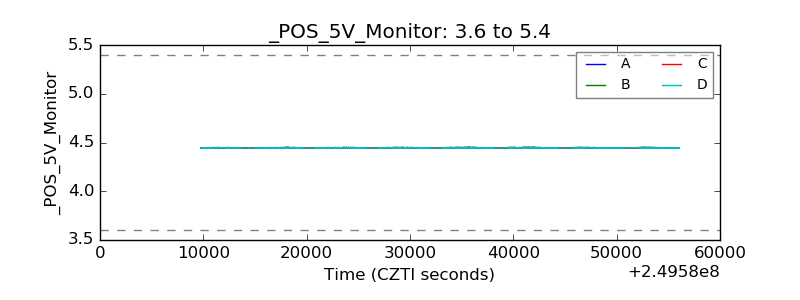 |
| _ROLL_ROT |  |
| _Roll_DEC |  |
| _Roll_RA |  |
| Veto Counter |  |