| Param | Original file | Final file |
|---|---|---|
| Filename | modeM0/AS1G08_075T01_9000001726cztM0_level2_bc.evt | modeM0/AS1G08_075T01_9000001726cztM0_level2_quad_clean.evt |
| Size (bytes) | 1,764,835,200 | 556,873,920 |
| Size | 1.6 GB | 531.1 MB |
| Events in quadrant A | 15,277,280 | 3,475,293 |
| Events in quadrant B | 12,647,504 | 3,493,285 |
| Events in quadrant C | 8,625,060 | 3,473,307 |
| Events in quadrant D | 13,809,136 | 3,314,011 |
| Mode M9 | |||
|---|---|---|---|
| Quadrant | BADHDUFLAG | Total packets | Discarded packets |
| A | 0 | 45 | 0 |
| B | 0 | 45 | 0 |
| C | 0 | 45 | 0 |
| D | 0 | 45 | 0 |
| Mode M0 | |||
|---|---|---|---|
| Quadrant | BADHDUFLAG | Total packets | Discarded packets |
| A | 0 | 116764 | 0 |
| B | 0 | 107785 | 0 |
| C | 0 | 92756 | 0 |
| D | 0 | 107342 | 0 |
| Mode SS | |||
|---|---|---|---|
| Quadrant | BADHDUFLAG | Total packets | Discarded packets |
| A | 0 | 924 | 0 |
| B | 0 | 924 | 0 |
| C | 0 | 924 | 0 |
| D | 0 | 924 | 0 |
| Quadrant | Total seconds | Saturated seconds | Saturation percentage |
|---|---|---|---|
| A | 45307 | 1005 | 2.218200% |
| B | 45307 | 1612 | 3.557949% |
| C | 45307 | 275 | 0.606970% |
| D | 45307 | 1081 | 2.385945% |
Noise dominated data is calculated using 1-second bins in cleaned event files. If a bin has >2000 counts, and if more than 50% of those come from <1% of pixels, then it is considered to be noise-dominated and hence unusable.
| Quadrant | # 1 sec bins | Bins with >0 counts | Bins with >2000 counts | High rate bins dominated by noise | Noise dominated (total time) | Noise dominated (detector-on time) | Marked lightcurve |
|---|---|---|---|---|---|---|---|
| A | 49848 | 45310 | 16 | 16 | 0.03% | 0.04% |  |
| B | 49848 | 45310 | 22 | 22 | 0.04% | 0.05% |  |
| C | 49848 | 45311 | 0 | 0 | 0.00% | 0.00% |  |
| D | 49848 | 45311 | 144 | 144 | 0.29% | 0.32% |  |
Top three noisy pixels from each quadrant. If the there are fewer than three noisy pixels in the level2.evt file, extra rows are filled as -1
| Pixel properties | Quadrant properties | ||||||
|---|---|---|---|---|---|---|---|
| Quadrant | DetID | PixID | Counts | Sigma | Mean | Median | Sigma |
| A | 8 | 15 | 5862241 | 12023.12 | 2216 | 2176 | 487.4 |
| A | 1 | 162 | 402228 | 820.79 | 2216 | 2176 | 487.4 |
| A | 9 | 143 | 64166 | 127.19 | 2216 | 2176 | 487.4 |
| B | 4 | 239 | 2069215 | 4831.17 | 2218 | 2152 | 427.9 |
| B | 3 | 64 | 708324 | 1650.48 | 2218 | 2152 | 427.9 |
| B | 15 | 204 | 484908 | 1128.3 | 2218 | 2152 | 427.9 |
| C | 14 | 234 | 57664 | 114.38 | 2182 | 2144 | 485.4 |
| C | 13 | 61 | 12942 | 22.24 | 2182 | 2144 | 485.4 |
| C | 8 | 128 | 12140 | 20.59 | 2182 | 2144 | 485.4 |
| D | 1 | 52 | 1780307 | 3498.4 | 2183 | 2101 | 508.3 |
| D | 8 | 195 | 1596214 | 3136.22 | 2183 | 2101 | 508.3 |
| D | 7 | 80 | 677529 | 1328.82 | 2183 | 2101 | 508.3 |
Histogram calculated using DETX and DETY for each event in the final _common_clean file
| Quadrant A |  |
 |
Quadrant B |
|---|---|---|---|
| Quadrant D | 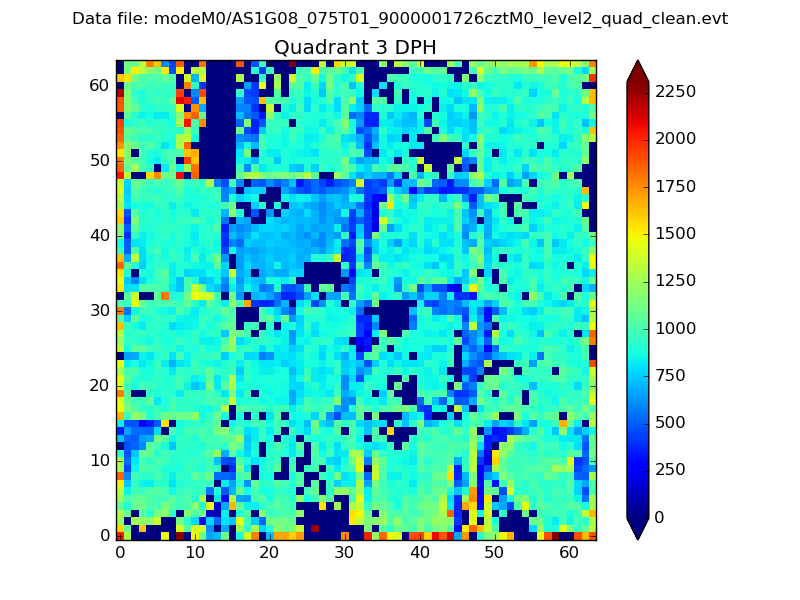 |
 |
Quadrant C |
| Plot type | Count rate plots | Images |
|---|---|---|
| Comparison with Poisson distribution Blue bars denote a histogram of data divided into 1 sec bins. Red curve is a Poisson curve with rate = median count rate of data. |
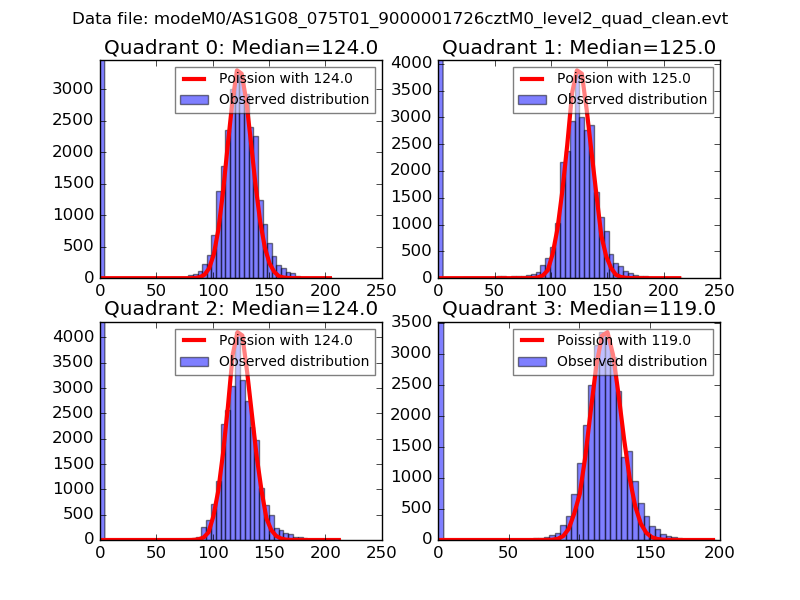 |
 |
| Quadrant-wise count rates Data is divided into 100 sec bins |
 |
|
| Module-wise count rates for Quadrant A Data is divided into 100 sec bins |
 |
 |
| Module-wise count rates for Quadrant B Data is divided into 100 sec bins |
 |
 |
| Module-wise count rates for Quadrant C Data is divided into 100 sec bins |
 |
 |
| Module-wise count rates for Quadrant D Data is divided into 100 sec bins |
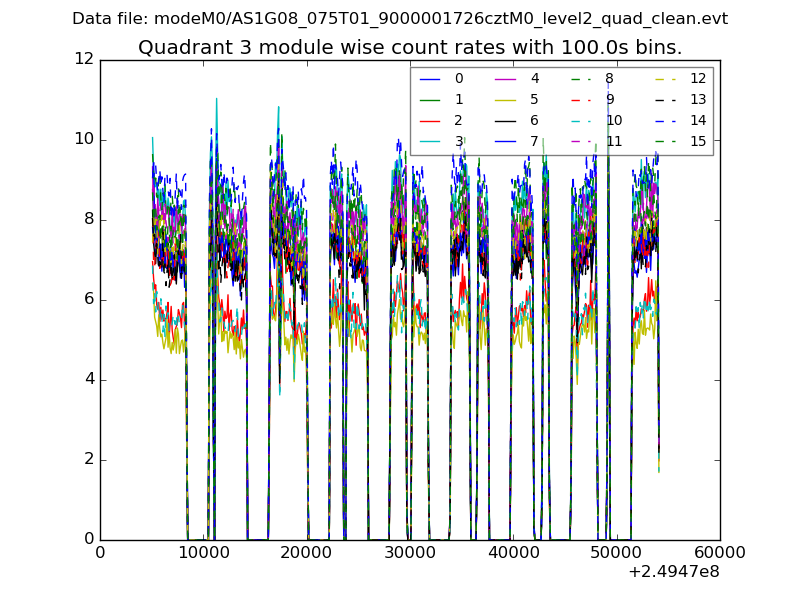 |
 |
| Parameter | Plot |
|---|---|
| CZT HV Monitor |  |
| D_VDD | 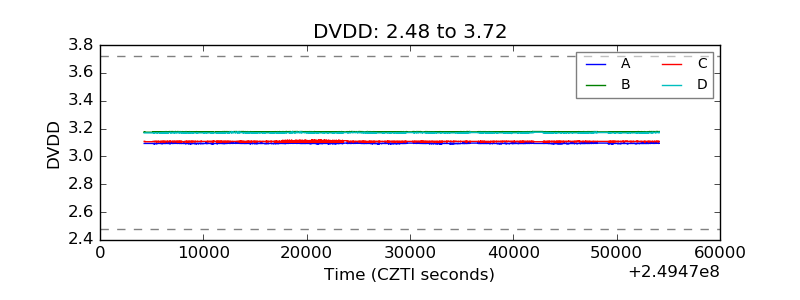 |
| Temperature 1 |  |
| Veto HV Monitor |  |
| Veto LLD | 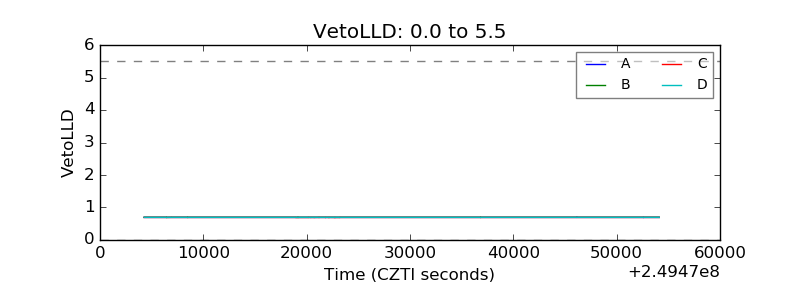 |
| Alpha Counter |  |
| _CPM_Rate |  |
| CZT Counter |  |
| +2.5 Volts monitor |  |
| +5 Volts monitor | 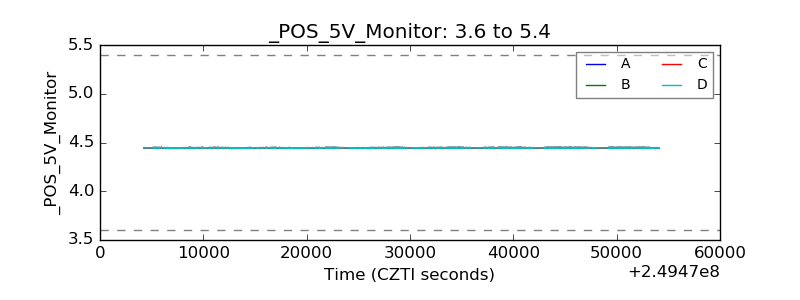 |
| _ROLL_ROT |  |
| _Roll_DEC |  |
| _Roll_RA |  |
| Veto Counter |  |