| Param | Original file | Final file |
|---|---|---|
| Filename | modeM0/AS1A04_227T01_9000001724cztM0_level2_bc.evt | modeM0/AS1A04_227T01_9000001724cztM0_level2_quad_clean.evt |
| Size (bytes) | 7,297,084,800 | 1,591,263,360 |
| Size | 6.8 GB | 1.5 GB |
| Events in quadrant A | 58,778,108 | 9,704,115 |
| Events in quadrant B | 44,408,190 | 9,989,321 |
| Events in quadrant C | 27,361,423 | 10,307,172 |
| Events in quadrant D | 81,185,337 | 8,854,453 |
| Mode M0 | |||
|---|---|---|---|
| Quadrant | BADHDUFLAG | Total packets | Discarded packets |
| A | 0 | 425715 | 0 |
| B | 0 | 347656 | 0 |
| C | 0 | 280230 | 0 |
| D | 0 | 511815 | 0 |
| Mode M9 | |||
|---|---|---|---|
| Quadrant | BADHDUFLAG | Total packets | Discarded packets |
| A | 0 | 215 | 0 |
| B | 0 | 215 | 0 |
| C | 0 | 215 | 0 |
| D | 0 | 215 | 0 |
| Mode SS | |||
|---|---|---|---|
| Quadrant | BADHDUFLAG | Total packets | Discarded packets |
| A | 0 | 2772 | 0 |
| B | 0 | 2772 | 0 |
| C | 0 | 2772 | 0 |
| D | 0 | 2772 | 0 |
| Quadrant | Total seconds | Saturated seconds | Saturation percentage |
|---|---|---|---|
| A | 136178 | 11964 | 8.785560% |
| B | 136200 | 6685 | 4.908223% |
| C | 136200 | 885 | 0.649780% |
| D | 136176 | 24716 | 18.150041% |
Noise dominated data is calculated using 1-second bins in cleaned event files. If a bin has >2000 counts, and if more than 50% of those come from <1% of pixels, then it is considered to be noise-dominated and hence unusable.
| Quadrant | # 1 sec bins | Bins with >0 counts | Bins with >2000 counts | High rate bins dominated by noise | Noise dominated (total time) | Noise dominated (detector-on time) | Marked lightcurve |
|---|---|---|---|---|---|---|---|
| A | 157586 | 136183 | 565 | 565 | 0.36% | 0.41% |  |
| B | 157586 | 136164 | 200 | 200 | 0.13% | 0.15% |  |
| C | 157586 | 136204 | 4 | 4 | 0.00% | 0.00% | 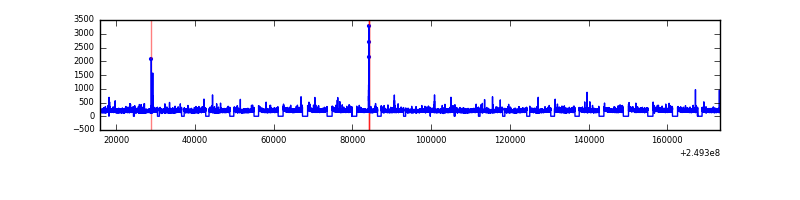 |
| D | 157586 | 136182 | 1887 | 1887 | 1.20% | 1.39% | 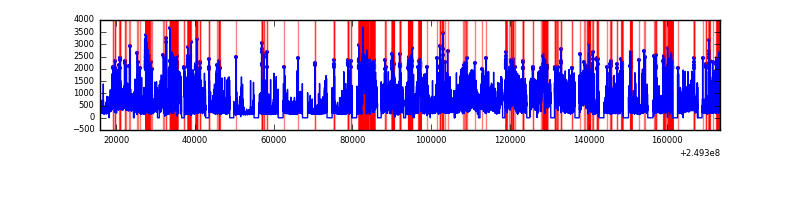 |
Top three noisy pixels from each quadrant. If the there are fewer than three noisy pixels in the level2.evt file, extra rows are filled as -1
| Pixel properties | Quadrant properties | ||||||
|---|---|---|---|---|---|---|---|
| Quadrant | DetID | PixID | Counts | Sigma | Mean | Median | Sigma |
| A | 8 | 5 | 25972820 | 17850.53 | 6758 | 6625 | 1454.6 |
| A | 1 | 162 | 1897400 | 1299.82 | 6758 | 6625 | 1454.6 |
| A | 6 | 16 | 1396790 | 955.67 | 6758 | 6625 | 1454.6 |
| B | 4 | 239 | 7328290 | 5630.16 | 6953 | 6768 | 1300.4 |
| B | 3 | 64 | 5010817 | 3848.05 | 6953 | 6768 | 1300.4 |
| B | 10 | 244 | 1222473 | 934.86 | 6953 | 6768 | 1300.4 |
| C | 14 | 234 | 77185 | 46.64 | 6946 | 6850 | 1508.1 |
| C | 13 | 61 | 41906 | 23.24 | 6946 | 6850 | 1508.1 |
| C | 8 | 222 | 41605 | 23.04 | 6946 | 6850 | 1508.1 |
| D | 13 | 152 | 38137300 | 25651.8 | 6426 | 6205 | 1486.5 |
| D | 8 | 195 | 4417944 | 2967.89 | 6426 | 6205 | 1486.5 |
| D | 7 | 80 | 3822059 | 2567.03 | 6426 | 6205 | 1486.5 |
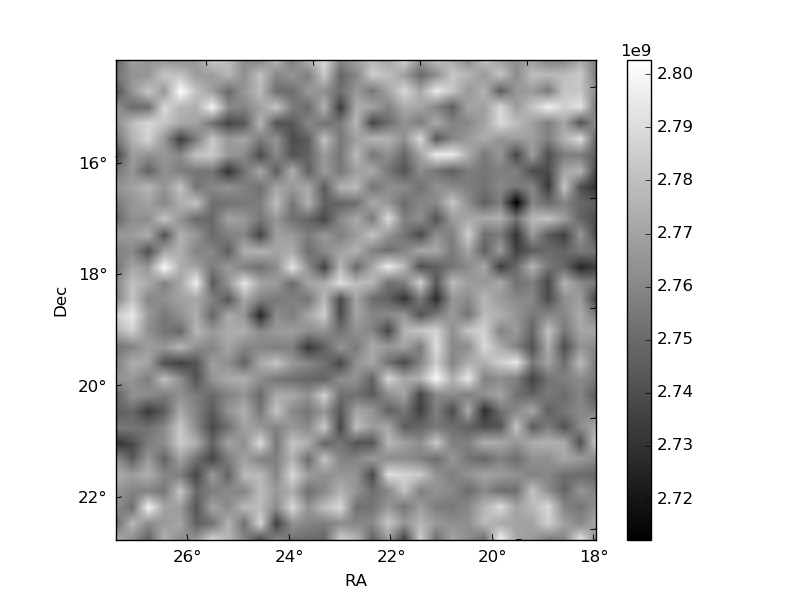
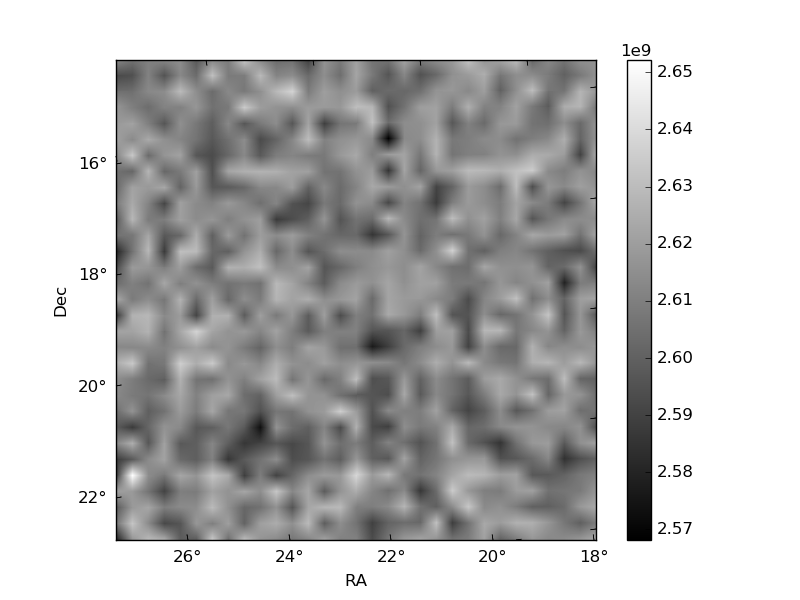
Histogram calculated using DETX and DETY for each event in the final _common_clean file
| Quadrant A |  |
 |
Quadrant B |
|---|---|---|---|
| Quadrant D | 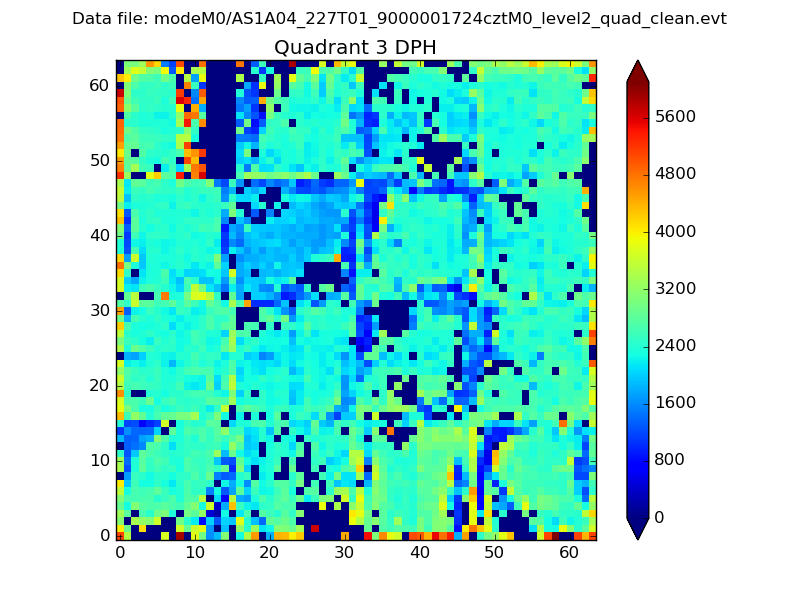 |
 |
Quadrant C |
| Plot type | Count rate plots | Images |
|---|---|---|
| Comparison with Poisson distribution Blue bars denote a histogram of data divided into 1 sec bins. Red curve is a Poisson curve with rate = median count rate of data. |
 |
 |
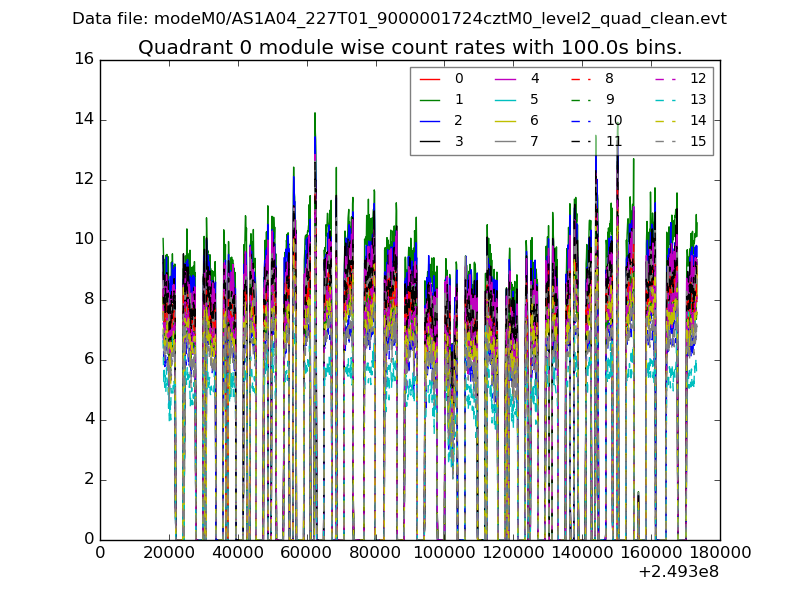
| Quadrant-wise count rates Data is divided into 100 sec bins |
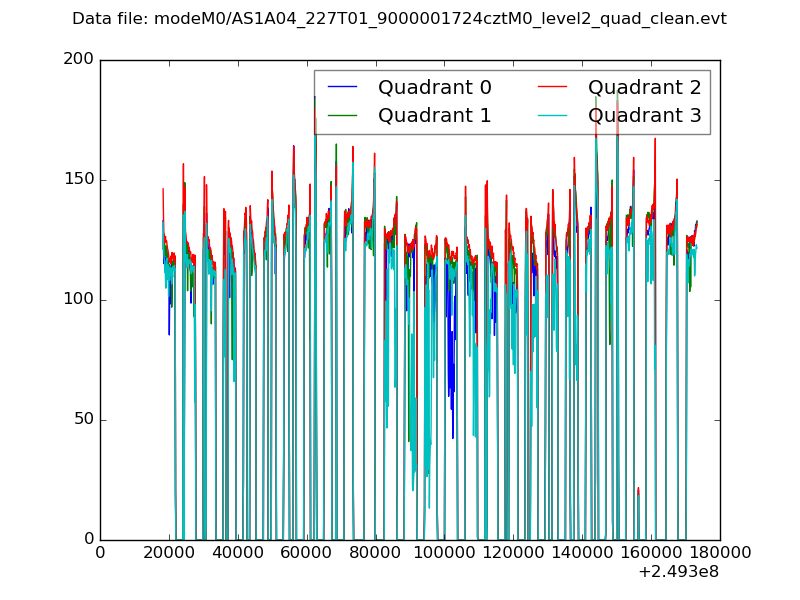 |
|
| Module-wise count rates for Quadrant A Data is divided into 100 sec bins |
 |
 |
| Module-wise count rates for Quadrant B Data is divided into 100 sec bins |
 |
 |
| Module-wise count rates for Quadrant C Data is divided into 100 sec bins |
 |
 |
| Module-wise count rates for Quadrant D Data is divided into 100 sec bins |
 |
 |
| Parameter | Plot |
|---|---|
| CZT HV Monitor |  |
| D_VDD |  |
| Temperature 1 |  |
| Veto HV Monitor |  |
| Veto LLD | 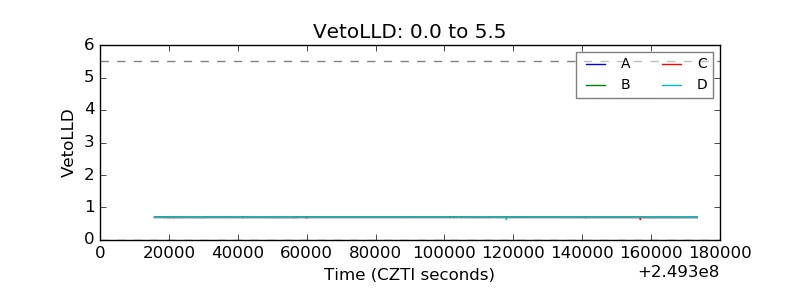 |
| Alpha Counter |  |
| _CPM_Rate |  |
| CZT Counter | 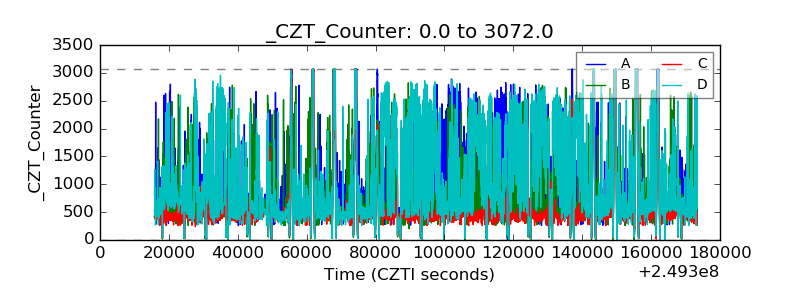 |
| +2.5 Volts monitor | 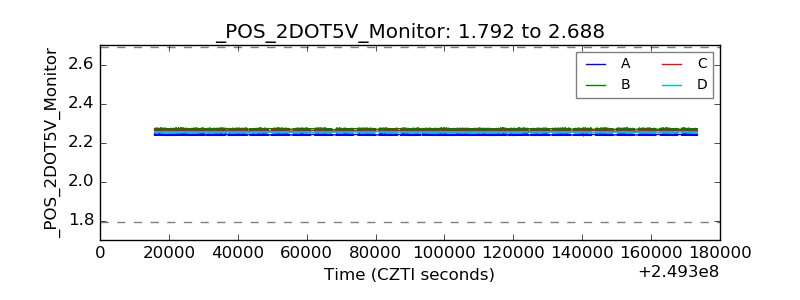 |
| +5 Volts monitor |  |
| _ROLL_ROT |  |
| _Roll_DEC |  |
| _Roll_RA |  |
| Veto Counter | 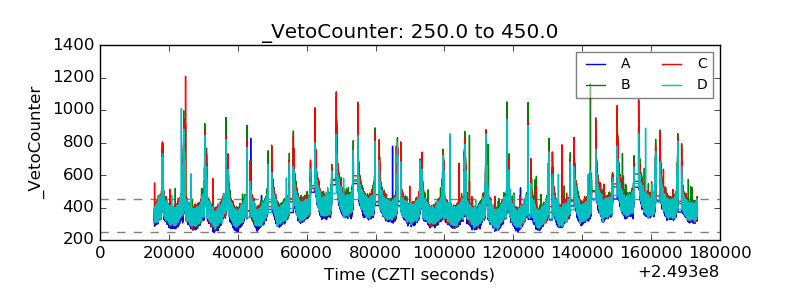 |