| Param | Original file | Final file |
|---|---|---|
| Filename | modeM0/AS1T01_207T01_9000001720cztM0_level2.evt | modeM0/AS1T01_207T01_9000001720cztM0_level2_quad_clean.evt |
| Size (bytes) | 5,096,646,720 | 784,048,320 |
| Size | 4.7 GB | 747.7 MB |
| Events in quadrant A | 49,192,081 | 4,808,931 |
| Events in quadrant B | 37,497,975 | 5,005,225 |
| Events in quadrant C | 27,933,742 | 5,012,217 |
| Events in quadrant D | 35,659,695 | 4,774,242 |
| Mode SS | |||
|---|---|---|---|
| Quadrant | BADHDUFLAG | Total packets | Discarded packets |
| A | 0 | 1230 | 0 |
| B | 0 | 1230 | 0 |
| C | 0 | 1230 | 0 |
| D | 0 | 1230 | 0 |
| Mode M9 | |||
|---|---|---|---|
| Quadrant | BADHDUFLAG | Total packets | Discarded packets |
| A | 0 | 88 | 0 |
| B | 0 | 88 | 0 |
| C | 0 | 88 | 0 |
| D | 0 | 88 | 0 |
| Mode M0 | |||
|---|---|---|---|
| Quadrant | BADHDUFLAG | Total packets | Discarded packets |
| A | 0 | 187448 | 0 |
| B | 0 | 150276 | 0 |
| C | 0 | 124325 | 0 |
| D | 0 | 145932 | 0 |
| Quadrant | Total seconds | Saturated seconds | Saturation percentage |
|---|---|---|---|
| A | 60444 | 5591 | 9.249884% |
| B | 60444 | 2995 | 4.955000% |
| C | 60444 | 634 | 1.048905% |
| D | 60444 | 1769 | 2.926676% |
Noise dominated data is calculated using 1-second bins in cleaned event files. If a bin has >2000 counts, and if more than 50% of those come from <1% of pixels, then it is considered to be noise-dominated and hence unusable.
| Quadrant | # 1 sec bins | Bins with >0 counts | Bins with >2000 counts | High rate bins dominated by noise | Noise dominated (total time) | Noise dominated (detector-on time) | Marked lightcurve |
|---|---|---|---|---|---|---|---|
| A | 69331 | 60458 | 2989 | 2989 | 4.31% | 4.94% |  |
| B | 69331 | 60461 | 1073 | 1073 | 1.55% | 1.77% | 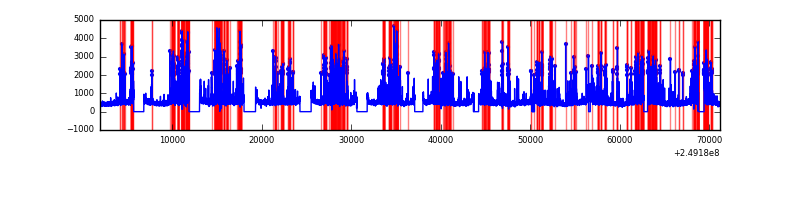 |
| C | 69331 | 60461 | 0 | 0 | 0.00% | 0.00% |  |
| D | 69331 | 60460 | 902 | 902 | 1.30% | 1.49% |  |
Top three noisy pixels from each quadrant. If the there are fewer than three noisy pixels in the level2.evt file, extra rows are filled as -1
| Pixel properties | Quadrant properties | ||||||
|---|---|---|---|---|---|---|---|
| Quadrant | DetID | PixID | Counts | Sigma | Mean | Median | Sigma |
| A | 8 | 5 | 16839360 | 11833.25 | 7060 | 6918 | 1422.5 |
| A | 1 | 162 | 1912993 | 1339.98 | 7060 | 6918 | 1422.5 |
| A | 1 | 178 | 1109398 | 775.05 | 7060 | 6918 | 1422.5 |
| B | 4 | 239 | 5605644 | 4150.69 | 7215 | 7026 | 1348.8 |
| B | 3 | 64 | 2116417 | 1563.85 | 7215 | 7026 | 1348.8 |
| B | 15 | 204 | 821711 | 603.99 | 7215 | 7026 | 1348.8 |
| C | 13 | 61 | 52893 | 28.01 | 7164 | 7194 | 1631.3 |
| C | 14 | 234 | 19716 | 7.68 | 7164 | 7194 | 1631.3 |
| C | 3 | 202 | 17957 | 6.6 | 7164 | 7194 | 1631.3 |
| D | 13 | 104 | 4178111 | 2483.0 | 7067 | 6873 | 1679.9 |
| D | 1 | 52 | 1526997 | 904.88 | 7067 | 6873 | 1679.9 |
| D | 8 | 195 | 1286289 | 761.59 | 7067 | 6873 | 1679.9 |
Histogram calculated using DETX and DETY for each event in the final _common_clean file
| Quadrant A |  |
 |
Quadrant B |
|---|---|---|---|
| Quadrant D |  |
 |
Quadrant C |
| Plot type | Count rate plots | Images |
|---|---|---|
| Comparison with Poisson distribution Blue bars denote a histogram of data divided into 1 sec bins. Red curve is a Poisson curve with rate = median count rate of data. |
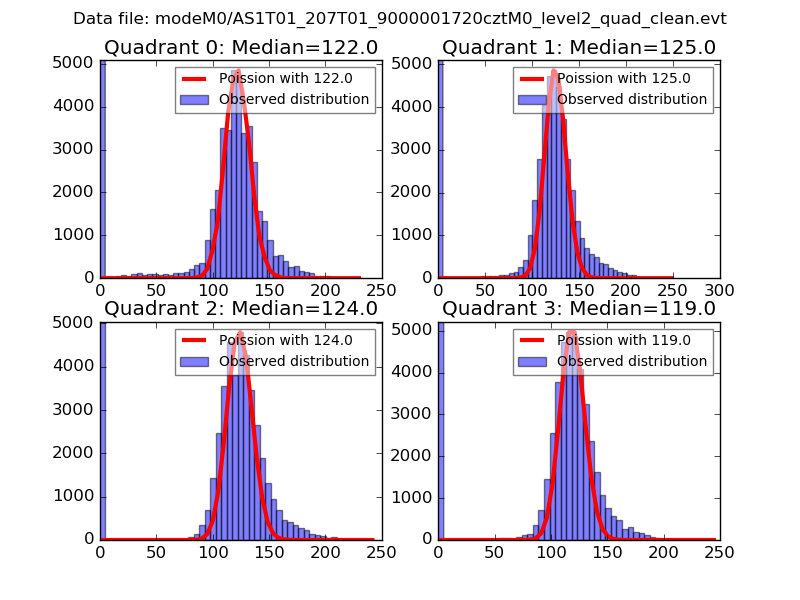 |
 |
| Quadrant-wise count rates Data is divided into 100 sec bins |
 |
|
| Module-wise count rates for Quadrant A Data is divided into 100 sec bins |
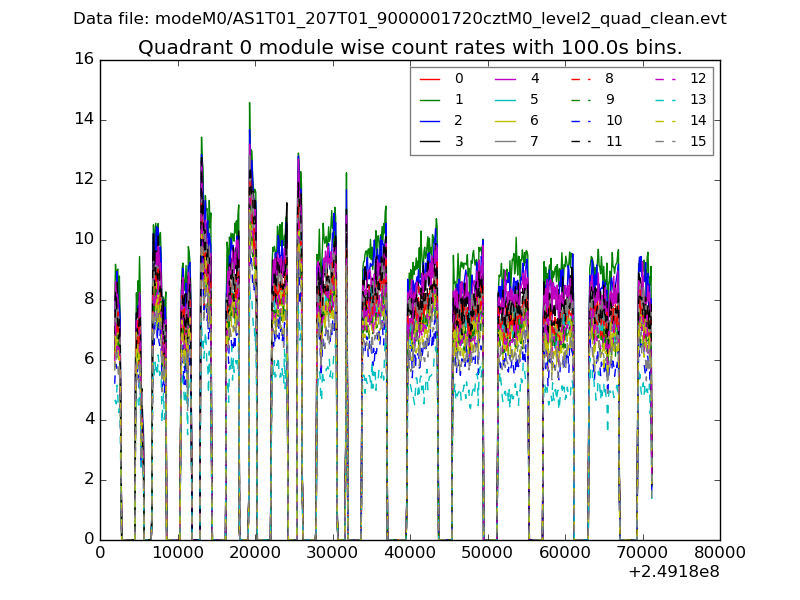 |
 |
| Module-wise count rates for Quadrant B Data is divided into 100 sec bins |
 |
 |
| Module-wise count rates for Quadrant C Data is divided into 100 sec bins |
 |
 |
| Module-wise count rates for Quadrant D Data is divided into 100 sec bins |
 |
 |
| Parameter | Plot |
|---|---|
| CZT HV Monitor |  |
| D_VDD |  |
| Temperature 1 |  |
| Veto HV Monitor | 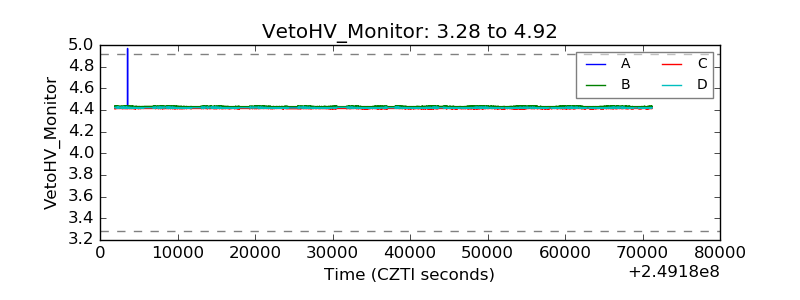 |
| Veto LLD | 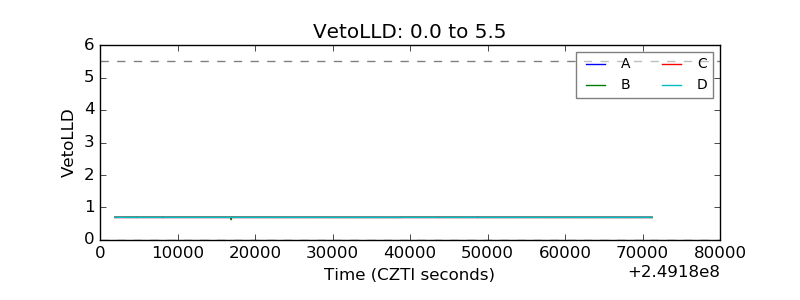 |
| Alpha Counter | 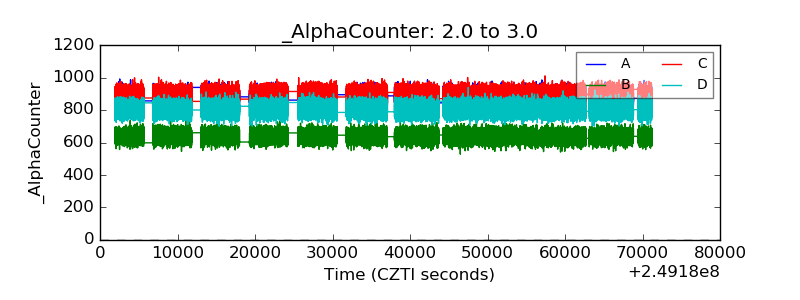 |
| _CPM_Rate |  |
| CZT Counter |  |
| +2.5 Volts monitor |  |
| +5 Volts monitor |  |
| _ROLL_ROT |  |
| _Roll_DEC |  |
| _Roll_RA |  |
| Veto Counter |  |