| Param | Original file | Final file |
|---|---|---|
| Filename | modeM0/AS1A04_037T03_9000001722cztM0_level2_bc.evt | modeM0/AS1A04_037T03_9000001722cztM0_level2_quad_clean.evt |
| Size (bytes) | 2,319,958,080 | 639,901,440 |
| Size | 2.2 GB | 610.3 MB |
| Events in quadrant A | 19,674,078 | 3,849,902 |
| Events in quadrant B | 17,383,698 | 4,053,100 |
| Events in quadrant C | 10,817,389 | 4,020,675 |
| Events in quadrant D | 18,753,409 | 3,800,531 |
| Mode M0 | |||
|---|---|---|---|
| Quadrant | BADHDUFLAG | Total packets | Discarded packets |
| A | 0 | 155297 | 0 |
| B | 0 | 136206 | 0 |
| C | 0 | 109807 | 0 |
| D | 0 | 134825 | 0 |
| Mode SS | |||
|---|---|---|---|
| Quadrant | BADHDUFLAG | Total packets | Discarded packets |
| A | 0 | 1086 | 0 |
| B | 0 | 1086 | 0 |
| C | 0 | 1086 | 0 |
| D | 0 | 1086 | 0 |
| Mode M9 | |||
|---|---|---|---|
| Quadrant | BADHDUFLAG | Total packets | Discarded packets |
| A | 0 | 99 | 0 |
| B | 0 | 99 | 0 |
| C | 0 | 99 | 0 |
| D | 0 | 99 | 0 |
| Quadrant | Total seconds | Saturated seconds | Saturation percentage |
|---|---|---|---|
| A | 53294 | 3859 | 7.240965% |
| B | 53294 | 3488 | 6.544827% |
| C | 53294 | 558 | 1.047022% |
| D | 53294 | 1568 | 2.942170% |
Noise dominated data is calculated using 1-second bins in cleaned event files. If a bin has >2000 counts, and if more than 50% of those come from <1% of pixels, then it is considered to be noise-dominated and hence unusable.
| Quadrant | # 1 sec bins | Bins with >0 counts | Bins with >2000 counts | High rate bins dominated by noise | Noise dominated (total time) | Noise dominated (detector-on time) | Marked lightcurve |
|---|---|---|---|---|---|---|---|
| A | 63170 | 53295 | 109 | 109 | 0.17% | 0.20% |  |
| B | 63170 | 53288 | 441 | 441 | 0.70% | 0.83% |  |
| C | 63170 | 53297 | 0 | 0 | 0.00% | 0.00% |  |
| D | 63170 | 53297 | 137 | 137 | 0.22% | 0.26% | 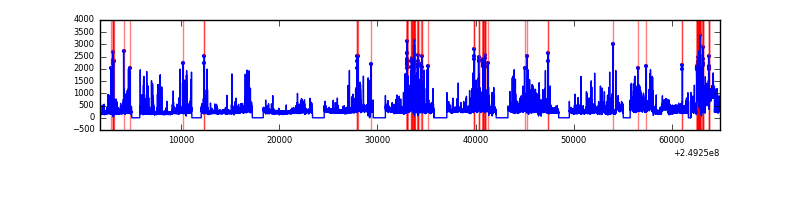 |
Top three noisy pixels from each quadrant. If the there are fewer than three noisy pixels in the level2.evt file, extra rows are filled as -1
| Pixel properties | Quadrant properties | ||||||
|---|---|---|---|---|---|---|---|
| Quadrant | DetID | PixID | Counts | Sigma | Mean | Median | Sigma |
| A | 8 | 5 | 8128691 | 14116.75 | 2678 | 2624 | 575.6 |
| A | 1 | 162 | 724660 | 1254.33 | 2678 | 2624 | 575.6 |
| A | 5 | 112 | 151402 | 258.46 | 2678 | 2624 | 575.6 |
| B | 3 | 64 | 5418791 | 10627.55 | 2742 | 2672 | 509.6 |
| B | 4 | 239 | 651041 | 1272.23 | 2742 | 2672 | 509.6 |
| B | 15 | 204 | 392106 | 764.15 | 2742 | 2672 | 509.6 |
| C | 13 | 61 | 16455 | 22.81 | 2767 | 2730 | 601.7 |
| C | 7 | 247 | 8075 | 8.88 | 2767 | 2730 | 601.7 |
| C | 3 | 202 | 6833 | 6.82 | 2767 | 2730 | 601.7 |
| D | 8 | 195 | 2517142 | 4083.71 | 2726 | 2633 | 615.7 |
| D | 13 | 152 | 2502916 | 4060.6 | 2726 | 2633 | 615.7 |
| D | 1 | 52 | 1559847 | 2529.01 | 2726 | 2633 | 615.7 |
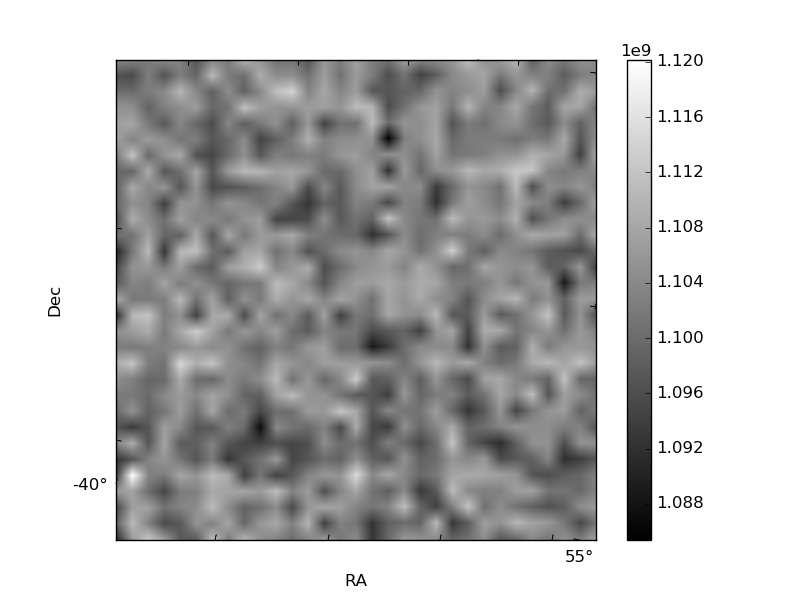
Histogram calculated using DETX and DETY for each event in the final _common_clean file
| Quadrant A | 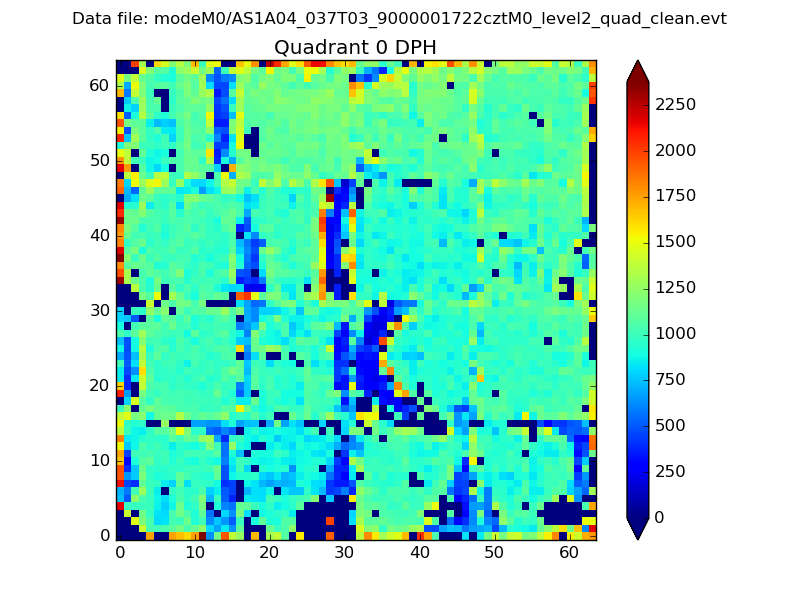 |
 |
Quadrant B |
|---|---|---|---|
| Quadrant D |  |
 |
Quadrant C |
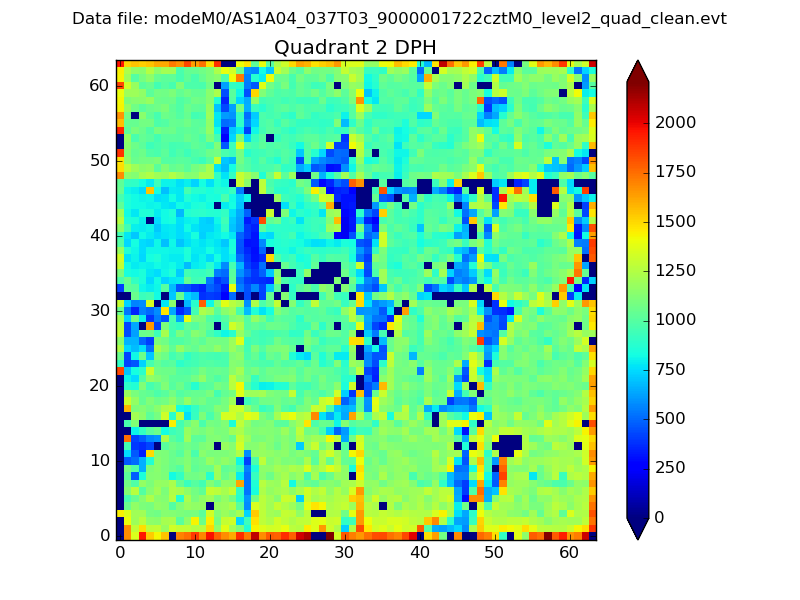
| Plot type | Count rate plots | Images |
|---|---|---|
| Comparison with Poisson distribution Blue bars denote a histogram of data divided into 1 sec bins. Red curve is a Poisson curve with rate = median count rate of data. |
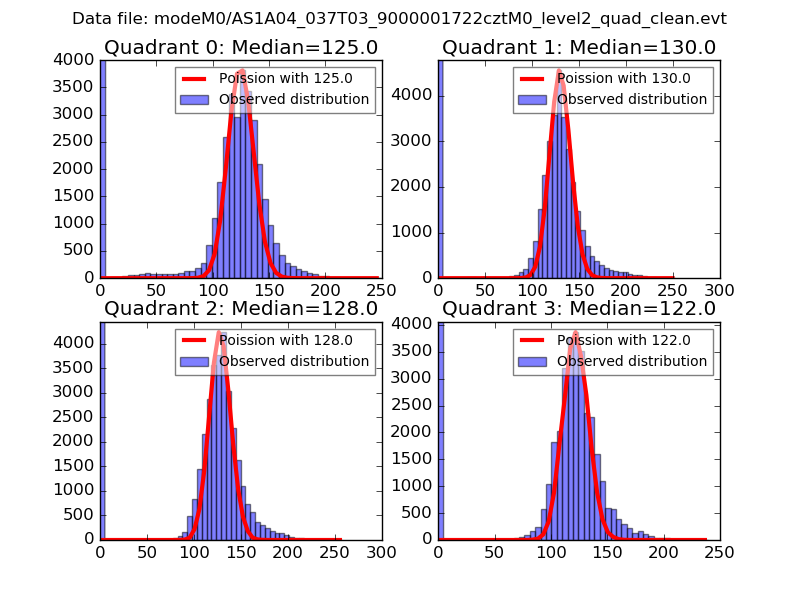 |
 |
| Quadrant-wise count rates Data is divided into 100 sec bins |
 |
|
| Module-wise count rates for Quadrant A Data is divided into 100 sec bins |
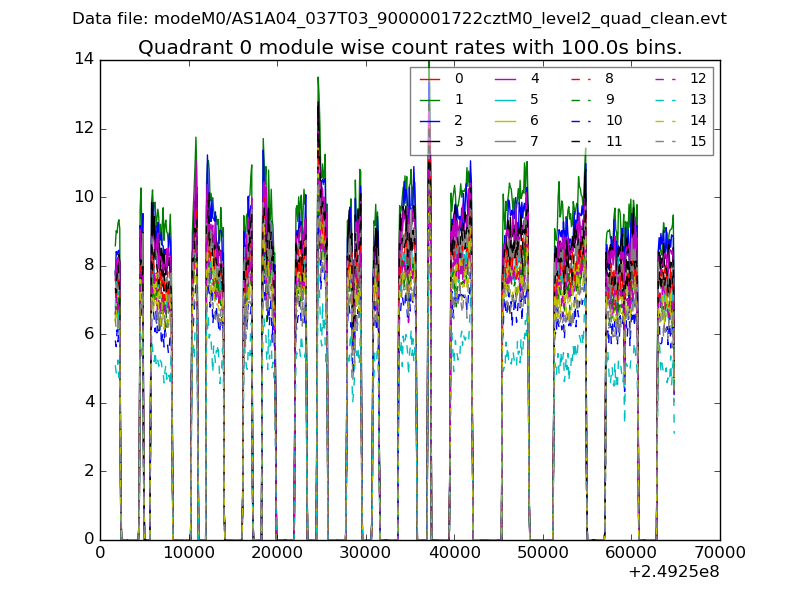 |
 |
| Module-wise count rates for Quadrant B Data is divided into 100 sec bins |
 |
 |
| Module-wise count rates for Quadrant C Data is divided into 100 sec bins |
 |
 |
| Module-wise count rates for Quadrant D Data is divided into 100 sec bins |
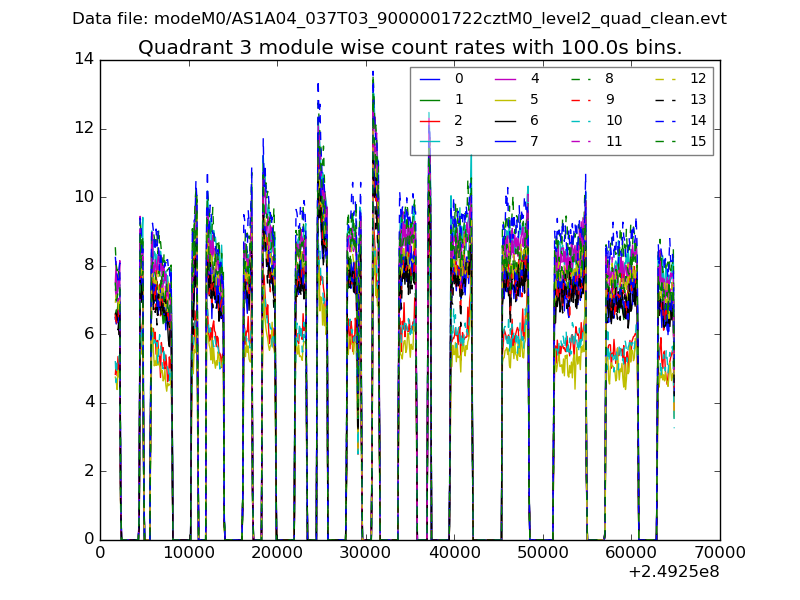 |
 |
| Parameter | Plot |
|---|---|
| CZT HV Monitor |  |
| D_VDD |  |
| Temperature 1 |  |
| Veto HV Monitor |  |
| Veto LLD |  |
| Alpha Counter |  |
| _CPM_Rate | 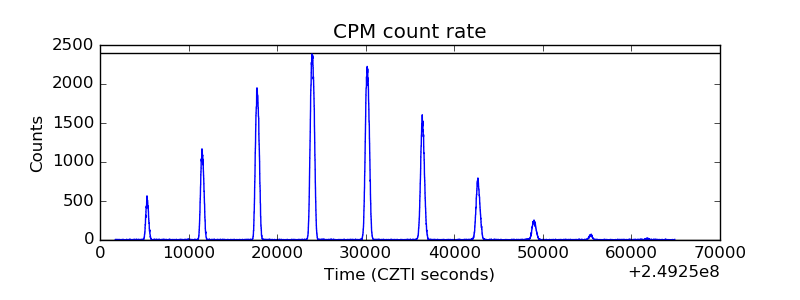 |
| CZT Counter |  |
| +2.5 Volts monitor | 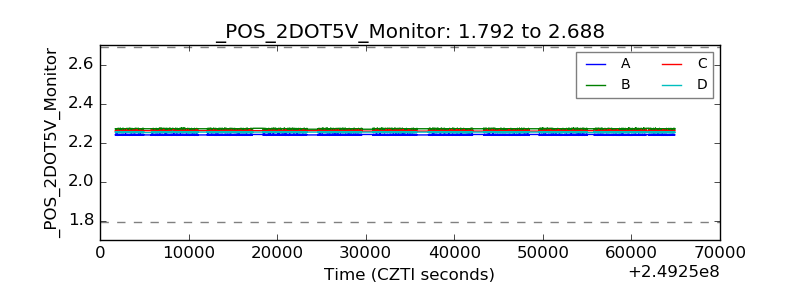 |
| +5 Volts monitor |  |
| _ROLL_ROT | 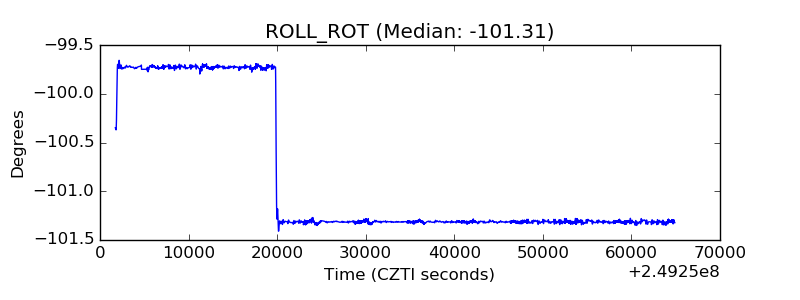 |
| _Roll_DEC |  |
| _Roll_RA |  |
| Veto Counter |  |