| Param | Original file | Final file |
|---|---|---|
| Filename | modeM0/AS1A04_037T02_9000001718cztM0_level2_bc.evt | modeM0/AS1A04_037T02_9000001718cztM0_level2_quad_clean.evt |
| Size (bytes) | 1,567,840,320 | 442,264,320 |
| Size | 1.5 GB | 421.8 MB |
| Events in quadrant A | 13,502,158 | 2,715,625 |
| Events in quadrant B | 8,104,336 | 2,819,722 |
| Events in quadrant C | 7,101,434 | 2,744,199 |
| Events in quadrant D | 16,210,315 | 2,534,879 |
| Mode SS | |||
|---|---|---|---|
| Quadrant | BADHDUFLAG | Total packets | Discarded packets |
| A | 0 | 766 | 0 |
| B | 0 | 766 | 0 |
| C | 0 | 766 | 0 |
| D | 0 | 766 | 0 |
| Mode M9 | |||
|---|---|---|---|
| Quadrant | BADHDUFLAG | Total packets | Discarded packets |
| A | 0 | 42 | 0 |
| B | 0 | 42 | 0 |
| C | 0 | 42 | 0 |
| D | 0 | 42 | 0 |
| Mode M0 | |||
|---|---|---|---|
| Quadrant | BADHDUFLAG | Total packets | Discarded packets |
| A | 0 | 108905 | 0 |
| B | 0 | 79857 | 0 |
| C | 0 | 76563 | 0 |
| D | 0 | 116945 | 0 |
| Quadrant | Total seconds | Saturated seconds | Saturation percentage |
|---|---|---|---|
| A | 37559 | 2274 | 6.054474% |
| B | 37559 | 392 | 1.043691% |
| C | 37559 | 106 | 0.282223% |
| D | 37559 | 4217 | 11.227668% |
Noise dominated data is calculated using 1-second bins in cleaned event files. If a bin has >2000 counts, and if more than 50% of those come from <1% of pixels, then it is considered to be noise-dominated and hence unusable.
| Quadrant | # 1 sec bins | Bins with >0 counts | Bins with >2000 counts | High rate bins dominated by noise | Noise dominated (total time) | Noise dominated (detector-on time) | Marked lightcurve |
|---|---|---|---|---|---|---|---|
| A | 41750 | 37562 | 124 | 124 | 0.30% | 0.33% |  |
| B | 41750 | 37560 | 1 | 1 | 0.00% | 0.00% |  |
| C | 41750 | 37560 | 0 | 0 | 0.00% | 0.00% |  |
| D | 41750 | 37560 | 14 | 14 | 0.03% | 0.04% |  |
Top three noisy pixels from each quadrant. If the there are fewer than three noisy pixels in the level2.evt file, extra rows are filled as -1
| Pixel properties | Quadrant properties | ||||||
|---|---|---|---|---|---|---|---|
| Quadrant | DetID | PixID | Counts | Sigma | Mean | Median | Sigma |
| A | 8 | 5 | 5733872 | 14503.07 | 1786 | 1745 | 395.2 |
| A | 1 | 162 | 602493 | 1519.97 | 1786 | 1745 | 395.2 |
| A | 1 | 178 | 86982 | 215.66 | 1786 | 1745 | 395.2 |
| B | 4 | 239 | 543697 | 1510.59 | 1855 | 1800 | 358.7 |
| B | 15 | 204 | 190964 | 527.31 | 1855 | 1800 | 358.7 |
| B | 0 | 214 | 107814 | 295.52 | 1855 | 1800 | 358.7 |
| C | 8 | 128 | 18691 | 42.52 | 1803 | 1772 | 398.0 |
| C | 13 | 61 | 10742 | 22.54 | 1803 | 1772 | 398.0 |
| C | 8 | 112 | 10121 | 20.98 | 1803 | 1772 | 398.0 |
| D | 13 | 104 | 8218425 | 20239.12 | 1735 | 1668 | 406.0 |
| D | 10 | 199 | 250964 | 614.05 | 1735 | 1668 | 406.0 |
| D | 8 | 195 | 250249 | 612.29 | 1735 | 1668 | 406.0 |
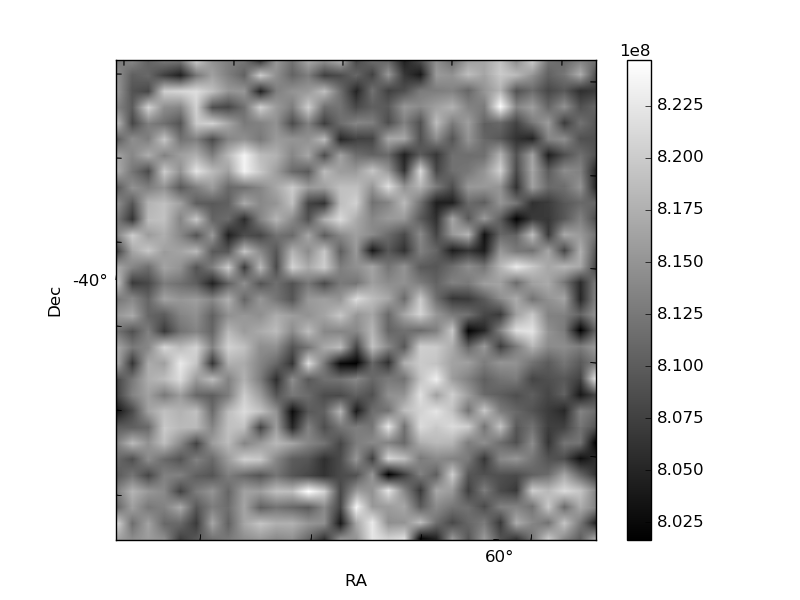
Histogram calculated using DETX and DETY for each event in the final _common_clean file
| Quadrant A |  |
 |
Quadrant B |
|---|---|---|---|
| Quadrant D |  |
 |
Quadrant C |
| Plot type | Count rate plots | Images |
|---|---|---|
| Comparison with Poisson distribution Blue bars denote a histogram of data divided into 1 sec bins. Red curve is a Poisson curve with rate = median count rate of data. |
 |
 |
| Quadrant-wise count rates Data is divided into 100 sec bins |
 |
|
| Module-wise count rates for Quadrant A Data is divided into 100 sec bins |
 |
 |
| Module-wise count rates for Quadrant B Data is divided into 100 sec bins |
 |
 |
| Module-wise count rates for Quadrant C Data is divided into 100 sec bins |
 |
 |
| Module-wise count rates for Quadrant D Data is divided into 100 sec bins |
 |
 |
| Parameter | Plot |
|---|---|
| CZT HV Monitor |  |
| D_VDD |  |
| Temperature 1 |  |
| Veto HV Monitor |  |
| Veto LLD |  |
| Alpha Counter |  |
| _CPM_Rate |  |
| CZT Counter |  |
| +2.5 Volts monitor |  |
| +5 Volts monitor | 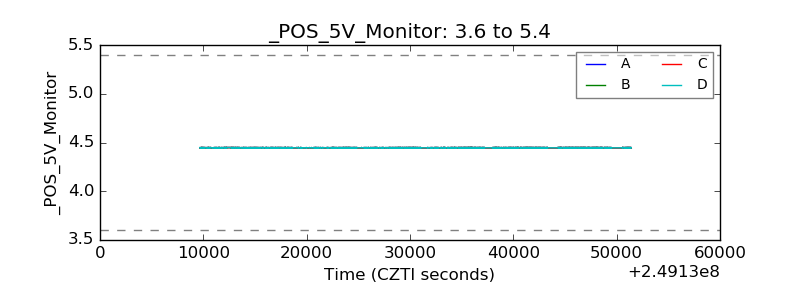 |
| _ROLL_ROT |  |
| _Roll_DEC |  |
| _Roll_RA |  |
| Veto Counter |  |