| Param | Original file | Final file |
|---|---|---|
| Filename | modeM0/AS1A04_037T01_9000001716cztM0_level2_bc.evt | modeM0/AS1A04_037T01_9000001716cztM0_level2_quad_clean.evt |
| Size (bytes) | 2,143,840,320 | 617,319,360 |
| Size | 2.0 GB | 588.7 MB |
| Events in quadrant A | 17,565,101 | 3,788,009 |
| Events in quadrant B | 13,284,872 | 3,901,622 |
| Events in quadrant C | 10,557,559 | 3,841,667 |
| Events in quadrant D | 19,996,890 | 3,618,918 |
| Mode M9 | |||
|---|---|---|---|
| Quadrant | BADHDUFLAG | Total packets | Discarded packets |
| A | 0 | 100 | 0 |
| B | 0 | 100 | 0 |
| C | 0 | 100 | 0 |
| D | 0 | 100 | 0 |
| Mode M0 | |||
|---|---|---|---|
| Quadrant | BADHDUFLAG | Total packets | Discarded packets |
| A | 0 | 142597 | 0 |
| B | 0 | 117691 | 0 |
| C | 0 | 106807 | 0 |
| D | 0 | 140604 | 0 |
| Mode SS | |||
|---|---|---|---|
| Quadrant | BADHDUFLAG | Total packets | Discarded packets |
| A | 0 | 1054 | 0 |
| B | 0 | 1054 | 0 |
| C | 0 | 1054 | 0 |
| D | 0 | 1054 | 0 |
| Quadrant | Total seconds | Saturated seconds | Saturation percentage |
|---|---|---|---|
| A | 51680 | 2374 | 4.593653% |
| B | 51680 | 1529 | 2.958591% |
| C | 51680 | 584 | 1.130031% |
| D | 51680 | 2788 | 5.394737% |
Noise dominated data is calculated using 1-second bins in cleaned event files. If a bin has >2000 counts, and if more than 50% of those come from <1% of pixels, then it is considered to be noise-dominated and hence unusable.
| Quadrant | # 1 sec bins | Bins with >0 counts | Bins with >2000 counts | High rate bins dominated by noise | Noise dominated (total time) | Noise dominated (detector-on time) | Marked lightcurve |
|---|---|---|---|---|---|---|---|
| A | 61691 | 51682 | 185 | 185 | 0.30% | 0.36% |  |
| B | 61691 | 51684 | 8 | 8 | 0.01% | 0.02% |  |
| C | 61691 | 51683 | 2 | 2 | 0.00% | 0.00% |  |
| D | 61691 | 51682 | 145 | 145 | 0.24% | 0.28% |  |
Top three noisy pixels from each quadrant. If the there are fewer than three noisy pixels in the level2.evt file, extra rows are filled as -1
| Pixel properties | Quadrant properties | ||||||
|---|---|---|---|---|---|---|---|
| Quadrant | DetID | PixID | Counts | Sigma | Mean | Median | Sigma |
| A | 8 | 5 | 6009999 | 10555.4 | 2643 | 2591 | 569.1 |
| A | 1 | 162 | 851394 | 1491.4 | 2643 | 2591 | 569.1 |
| A | 9 | 143 | 135626 | 233.75 | 2643 | 2591 | 569.1 |
| B | 4 | 239 | 2325885 | 4580.98 | 2720 | 2645 | 507.1 |
| B | 15 | 204 | 327986 | 641.51 | 2720 | 2645 | 507.1 |
| B | 3 | 209 | 95599 | 183.29 | 2720 | 2645 | 507.1 |
| C | 15 | 208 | 34033 | 54.29 | 2668 | 2632 | 578.4 |
| C | 8 | 128 | 23689 | 36.4 | 2668 | 2632 | 578.4 |
| C | 12 | 4 | 20818 | 31.44 | 2668 | 2632 | 578.4 |
| D | 13 | 104 | 3495026 | 5824.4 | 2622 | 2527 | 599.6 |
| D | 1 | 52 | 2287879 | 3811.25 | 2622 | 2527 | 599.6 |
| D | 8 | 195 | 1494711 | 2488.5 | 2622 | 2527 | 599.6 |
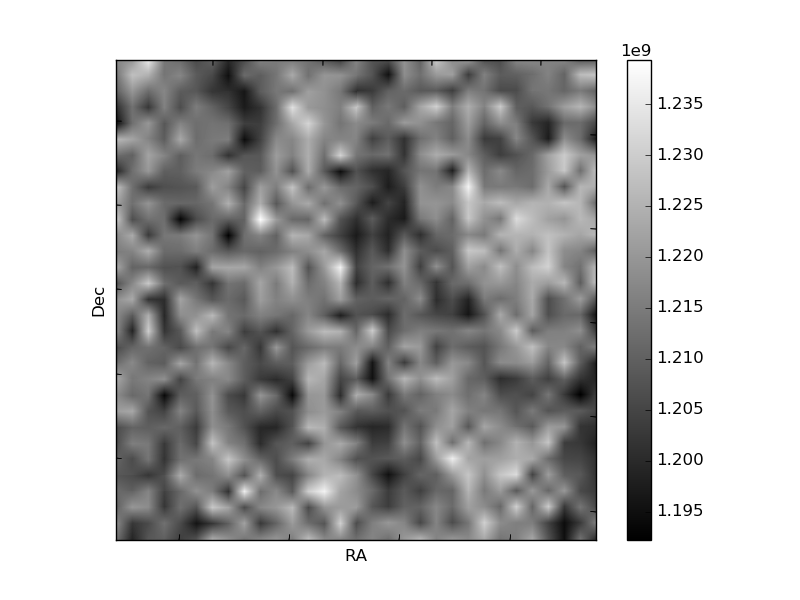
Histogram calculated using DETX and DETY for each event in the final _common_clean file
| Quadrant A | 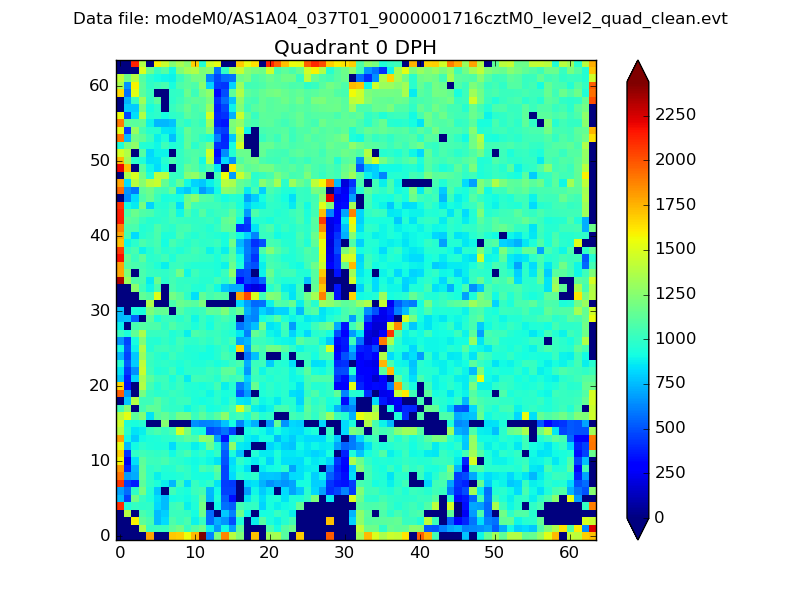 |
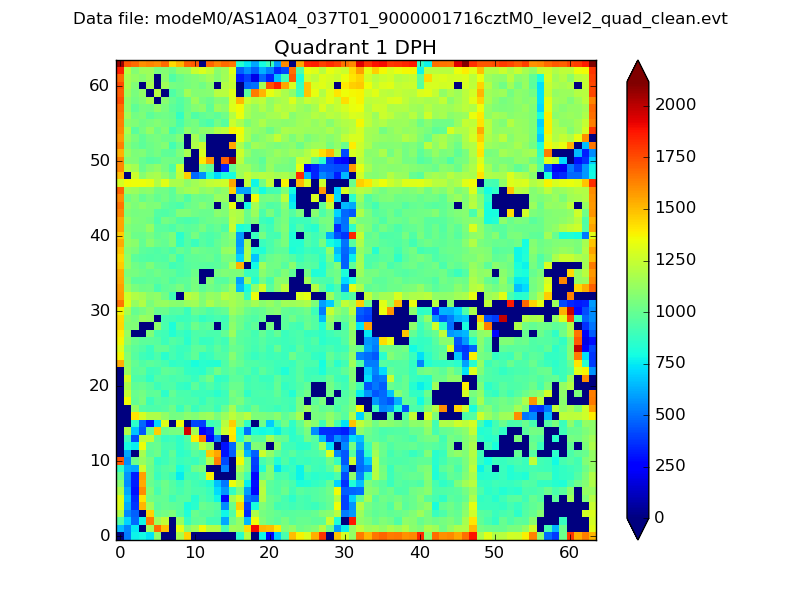 |
Quadrant B |
|---|---|---|---|
| Quadrant D |  |
 |
Quadrant C |
| Plot type | Count rate plots | Images |
|---|---|---|
| Comparison with Poisson distribution Blue bars denote a histogram of data divided into 1 sec bins. Red curve is a Poisson curve with rate = median count rate of data. |
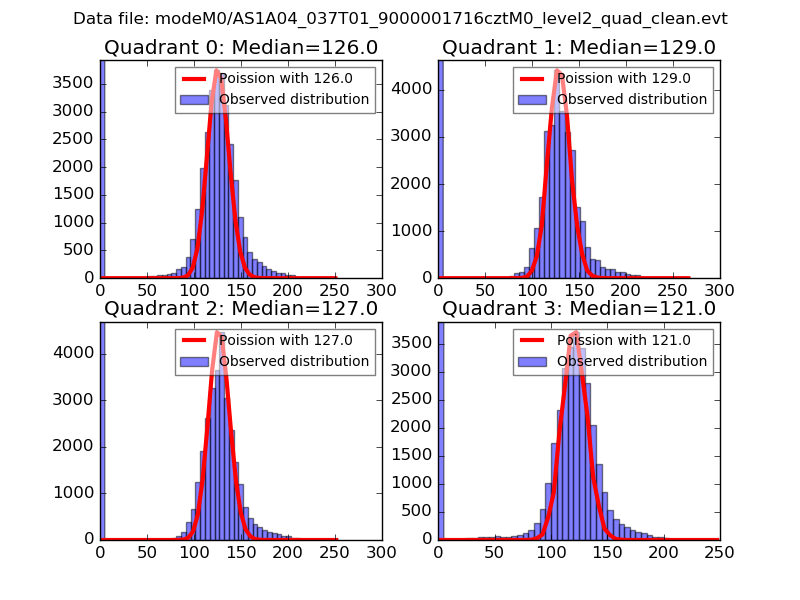 |
 |
| Quadrant-wise count rates Data is divided into 100 sec bins |
 |
|
| Module-wise count rates for Quadrant A Data is divided into 100 sec bins |
 |
 |
| Module-wise count rates for Quadrant B Data is divided into 100 sec bins |
 |
 |
| Module-wise count rates for Quadrant C Data is divided into 100 sec bins |
 |
 |
| Module-wise count rates for Quadrant D Data is divided into 100 sec bins |
 |
 |
| Parameter | Plot |
|---|---|
| CZT HV Monitor |  |
| D_VDD |  |
| Temperature 1 | 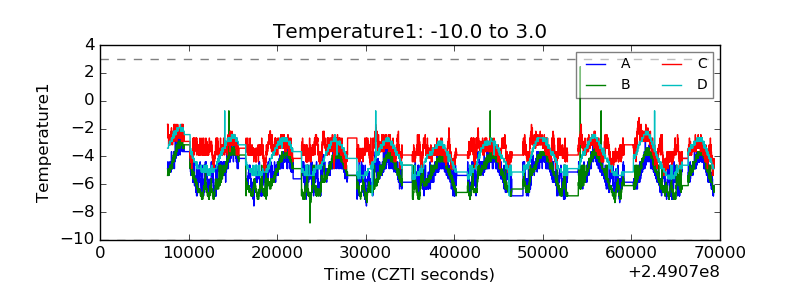 |
| Veto HV Monitor |  |
| Veto LLD |  |
| Alpha Counter |  |
| _CPM_Rate | 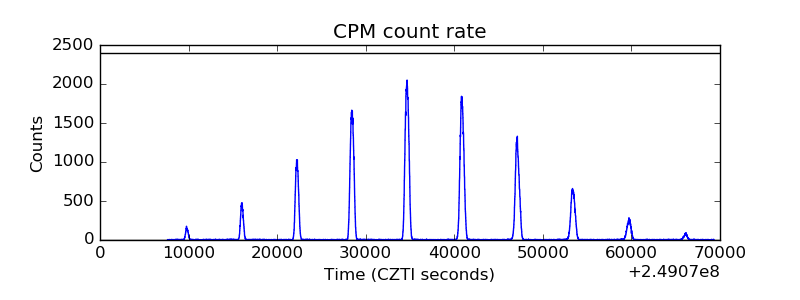 |
| CZT Counter |  |
| +2.5 Volts monitor | 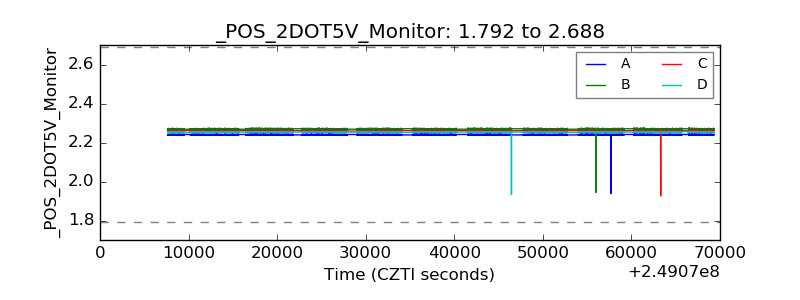 |
| +5 Volts monitor |  |
| _ROLL_ROT | 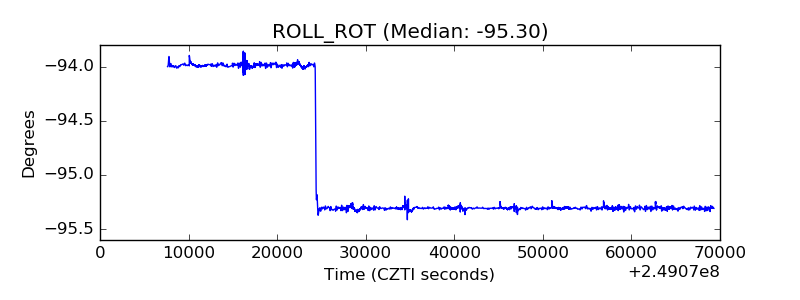 |
| _Roll_DEC |  |
| _Roll_RA |  |
| Veto Counter | 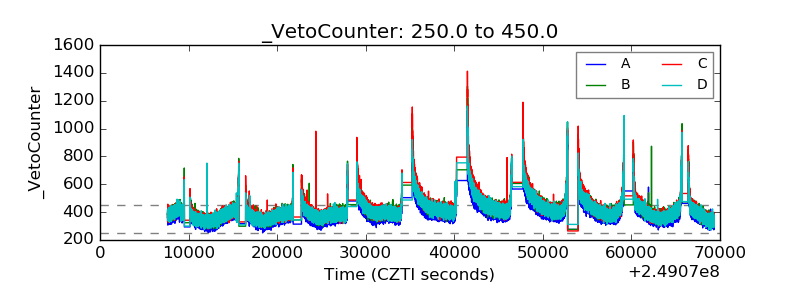 |