| Param | Original file | Final file |
|---|---|---|
| Filename | modeM0/AS1A04_026T04_9000001714cztM0_level2_bc.evt | modeM0/AS1A04_026T04_9000001714cztM0_level2_quad_clean.evt |
| Size (bytes) | 1,001,214,720 | 398,856,960 |
| Size | 954.8 MB | 380.4 MB |
| Events in quadrant A | 6,328,430 | 2,714,883 |
| Events in quadrant B | 6,667,478 | 2,708,402 |
| Events in quadrant C | 4,174,894 | 2,662,036 |
| Events in quadrant D | 11,632,136 | 2,465,510 |
| Mode SS | |||
|---|---|---|---|
| Quadrant | BADHDUFLAG | Total packets | Discarded packets |
| A | 0 | 452 | 0 |
| B | 0 | 452 | 0 |
| C | 0 | 452 | 0 |
| D | 0 | 452 | 0 |
| Mode M9 | |||
|---|---|---|---|
| Quadrant | BADHDUFLAG | Total packets | Discarded packets |
| A | 0 | 17 | 0 |
| B | 0 | 17 | 0 |
| C | 0 | 17 | 0 |
| D | 0 | 17 | 0 |
| Mode M0 | |||
|---|---|---|---|
| Quadrant | BADHDUFLAG | Total packets | Discarded packets |
| A | 0 | 57759 | 0 |
| B | 0 | 55099 | 0 |
| C | 0 | 45237 | 0 |
| D | 0 | 69456 | 0 |
| Quadrant | Total seconds | Saturated seconds | Saturation percentage |
|---|---|---|---|
| A | 22228 | 631 | 2.838762% |
| B | 22228 | 1083 | 4.872233% |
| C | 22228 | 161 | 0.724312% |
| D | 22228 | 1991 | 8.957171% |
Noise dominated data is calculated using 1-second bins in cleaned event files. If a bin has >2000 counts, and if more than 50% of those come from <1% of pixels, then it is considered to be noise-dominated and hence unusable.
| Quadrant | # 1 sec bins | Bins with >0 counts | Bins with >2000 counts | High rate bins dominated by noise | Noise dominated (total time) | Noise dominated (detector-on time) | Marked lightcurve |
|---|---|---|---|---|---|---|---|
| A | 23829 | 22230 | 5 | 5 | 0.02% | 0.02% |  |
| B | 23829 | 22229 | 4 | 4 | 0.02% | 0.02% |  |
| C | 23829 | 22229 | 3 | 3 | 0.01% | 0.01% |  |
| D | 23829 | 22227 | 980 | 980 | 4.11% | 4.41% | 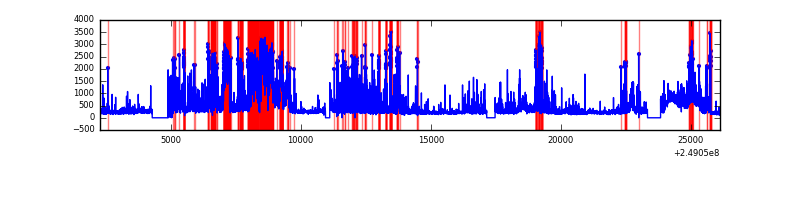 |
Top three noisy pixels from each quadrant. If the there are fewer than three noisy pixels in the level2.evt file, extra rows are filled as -1
| Pixel properties | Quadrant properties | ||||||
|---|---|---|---|---|---|---|---|
| Quadrant | DetID | PixID | Counts | Sigma | Mean | Median | Sigma |
| A | 8 | 5 | 1341464 | 5347.69 | 1085 | 1058 | 250.7 |
| A | 1 | 162 | 500270 | 1991.66 | 1085 | 1058 | 250.7 |
| A | 1 | 178 | 74631 | 293.53 | 1085 | 1058 | 250.7 |
| B | 4 | 239 | 1839722 | 8162.78 | 1080 | 1040 | 225.3 |
| B | 15 | 204 | 209259 | 924.38 | 1080 | 1040 | 225.3 |
| B | 0 | 219 | 197309 | 871.33 | 1080 | 1040 | 225.3 |
| C | 8 | 128 | 12552 | 48.24 | 1053 | 1035 | 238.7 |
| C | 12 | 4 | 9497 | 35.45 | 1053 | 1035 | 238.7 |
| C | 13 | 250 | 8268 | 30.3 | 1053 | 1035 | 238.7 |
| D | 1 | 52 | 3350524 | 13485.15 | 1031 | 992 | 248.4 |
| D | 10 | 253 | 1042344 | 4192.46 | 1031 | 992 | 248.4 |
| D | 13 | 137 | 852005 | 3426.16 | 1031 | 992 | 248.4 |
Histogram calculated using DETX and DETY for each event in the final _common_clean file
| Quadrant A |  |
 |
Quadrant B |
|---|---|---|---|
| Quadrant D |  |
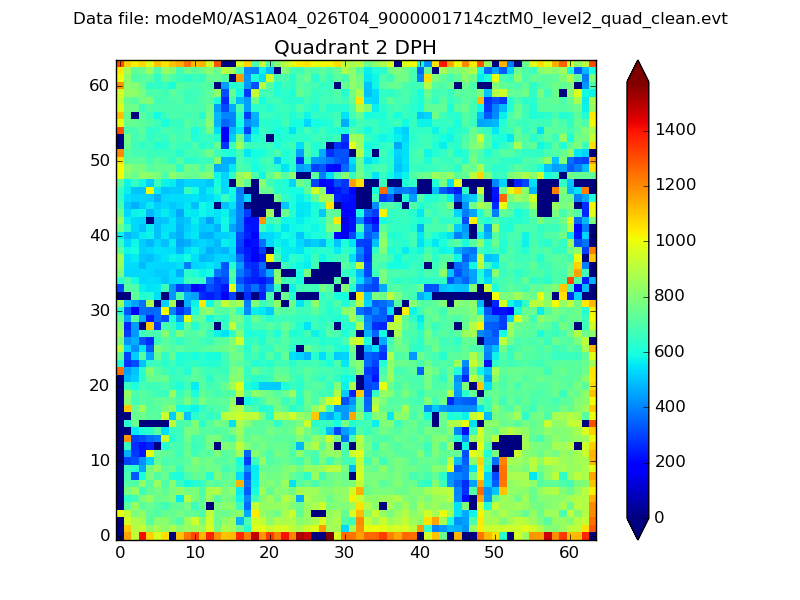 |
Quadrant C |
| Plot type | Count rate plots | Images |
|---|---|---|
| Comparison with Poisson distribution Blue bars denote a histogram of data divided into 1 sec bins. Red curve is a Poisson curve with rate = median count rate of data. |
 |
 |
| Quadrant-wise count rates Data is divided into 100 sec bins |
 |
|
| Module-wise count rates for Quadrant A Data is divided into 100 sec bins |
 |
 |
| Module-wise count rates for Quadrant B Data is divided into 100 sec bins |
 |
 |
| Module-wise count rates for Quadrant C Data is divided into 100 sec bins |
 |
 |
| Module-wise count rates for Quadrant D Data is divided into 100 sec bins |
 |
 |
| Parameter | Plot |
|---|---|
| CZT HV Monitor | 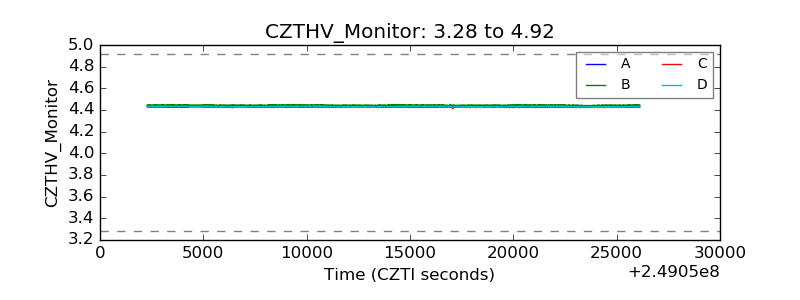 |
| D_VDD | 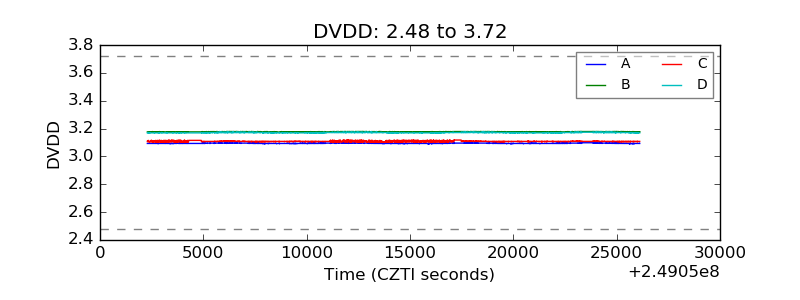 |
| Temperature 1 | 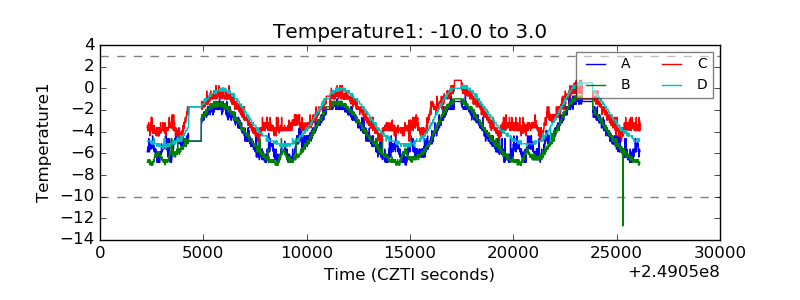 |
| Veto HV Monitor |  |
| Veto LLD |  |
| Alpha Counter |  |
| _CPM_Rate |  |
| CZT Counter |  |
| +2.5 Volts monitor |  |
| +5 Volts monitor |  |
| _ROLL_ROT |  |
| _Roll_DEC |  |
| _Roll_RA |  |
| Veto Counter |  |