| Param | Original file | Final file |
|---|---|---|
| Filename | modeM0/AS1A04_049T01_9000001710cztM0_level2_bc.evt | modeM0/AS1A04_049T01_9000001710cztM0_level2_quad_clean.evt |
| Size (bytes) | 1,552,236,480 | 303,704,640 |
| Size | 1.4 GB | 289.6 MB |
| Events in quadrant A | 13,545,842 | 1,829,234 |
| Events in quadrant B | 8,588,683 | 1,934,207 |
| Events in quadrant C | 5,265,391 | 1,998,657 |
| Events in quadrant D | 17,758,405 | 1,570,716 |
| Mode SS | |||
|---|---|---|---|
| Quadrant | BADHDUFLAG | Total packets | Discarded packets |
| A | 0 | 552 | 0 |
| B | 0 | 552 | 0 |
| C | 0 | 552 | 0 |
| D | 0 | 552 | 0 |
| Mode M9 | |||
|---|---|---|---|
| Quadrant | BADHDUFLAG | Total packets | Discarded packets |
| A | 0 | 50 | 0 |
| B | 0 | 50 | 0 |
| C | 0 | 50 | 0 |
| D | 0 | 50 | 0 |
| Mode M0 | |||
|---|---|---|---|
| Quadrant | BADHDUFLAG | Total packets | Discarded packets |
| A | 0 | 94470 | 0 |
| B | 0 | 69107 | 0 |
| C | 0 | 54963 | 0 |
| D | 0 | 117730 | 0 |
| Quadrant | Total seconds | Saturated seconds | Saturation percentage |
|---|---|---|---|
| A | 27083 | 3701 | 13.665399% |
| B | 27083 | 1186 | 4.379131% |
| C | 27083 | 67 | 0.247388% |
| D | 27083 | 9240 | 34.117343% |
Noise dominated data is calculated using 1-second bins in cleaned event files. If a bin has >2000 counts, and if more than 50% of those come from <1% of pixels, then it is considered to be noise-dominated and hence unusable.
| Quadrant | # 1 sec bins | Bins with >0 counts | Bins with >2000 counts | High rate bins dominated by noise | Noise dominated (total time) | Noise dominated (detector-on time) | Marked lightcurve |
|---|---|---|---|---|---|---|---|
| A | 31965 | 27083 | 348 | 348 | 1.09% | 1.28% | 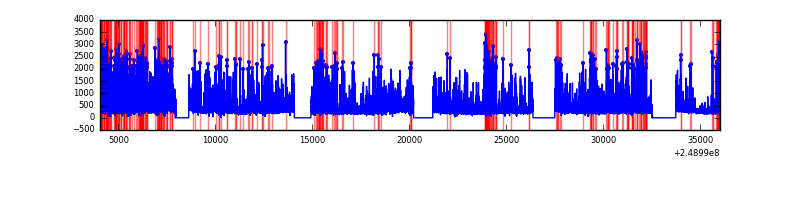 |
| B | 31965 | 27085 | 41 | 41 | 0.13% | 0.15% |  |
| C | 31965 | 27084 | 0 | 0 | 0.00% | 0.00% |  |
| D | 31965 | 27014 | 1817 | 1817 | 5.68% | 6.73% |  |
Top three noisy pixels from each quadrant. If the there are fewer than three noisy pixels in the level2.evt file, extra rows are filled as -1
| Pixel properties | Quadrant properties | ||||||
|---|---|---|---|---|---|---|---|
| Quadrant | DetID | PixID | Counts | Sigma | Mean | Median | Sigma |
| A | 8 | 5 | 8021739 | 28876.64 | 1273 | 1249 | 277.8 |
| A | 1 | 162 | 284031 | 1018.12 | 1273 | 1249 | 277.8 |
| A | 9 | 143 | 178777 | 639.16 | 1273 | 1249 | 277.8 |
| B | 4 | 239 | 2155018 | 8486.29 | 1339 | 1305 | 253.8 |
| B | 3 | 64 | 503617 | 1979.26 | 1339 | 1305 | 253.8 |
| B | 15 | 204 | 196329 | 768.45 | 1339 | 1305 | 253.8 |
| C | 12 | 4 | 12530 | 36.55 | 1340 | 1317 | 306.8 |
| C | 13 | 61 | 7943 | 21.6 | 1340 | 1317 | 306.8 |
| C | 1 | 5 | 6699 | 17.54 | 1340 | 1317 | 306.8 |
| D | 1 | 52 | 10126383 | 40584.05 | 1032 | 989 | 249.5 |
| D | 13 | 152 | 2484235 | 9953.21 | 1032 | 989 | 249.5 |
| D | 8 | 195 | 160174 | 638.04 | 1032 | 989 | 249.5 |
Histogram calculated using DETX and DETY for each event in the final _common_clean file
| Quadrant A |  |
 |
Quadrant B |
|---|---|---|---|
| Quadrant D |  |
 |
Quadrant C |
| Plot type | Count rate plots | Images |
|---|---|---|
| Comparison with Poisson distribution Blue bars denote a histogram of data divided into 1 sec bins. Red curve is a Poisson curve with rate = median count rate of data. |
 |
 |
| Quadrant-wise count rates Data is divided into 100 sec bins |
 |
|
| Module-wise count rates for Quadrant A Data is divided into 100 sec bins |
 |
 |
| Module-wise count rates for Quadrant B Data is divided into 100 sec bins |
 |
 |
| Module-wise count rates for Quadrant C Data is divided into 100 sec bins |
 |
 |
| Module-wise count rates for Quadrant D Data is divided into 100 sec bins |
 |
 |
| Parameter | Plot |
|---|---|
| CZT HV Monitor |  |
| D_VDD |  |
| Temperature 1 | 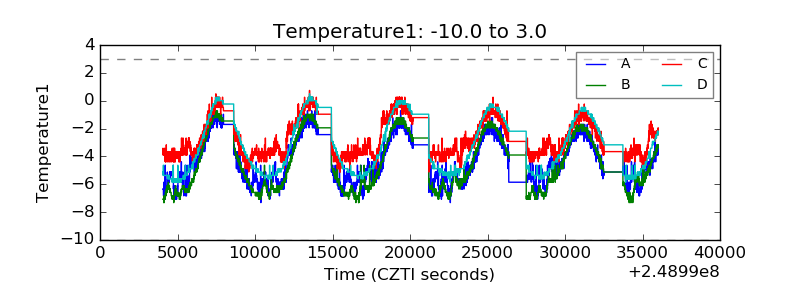 |
| Veto HV Monitor | 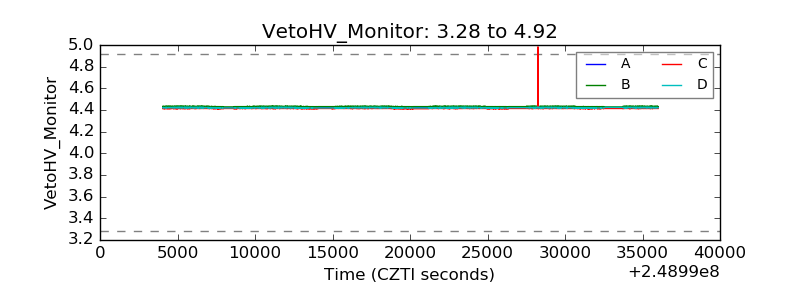 |
| Veto LLD |  |
| Alpha Counter |  |
| _CPM_Rate |  |
| CZT Counter |  |
| +2.5 Volts monitor |  |
| +5 Volts monitor |  |
| _ROLL_ROT |  |
| _Roll_DEC | 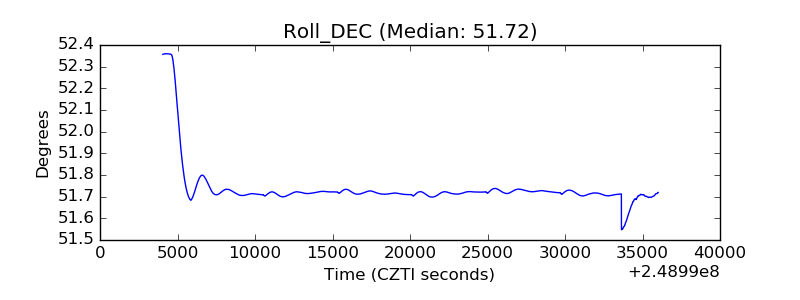 |
| _Roll_RA |  |
| Veto Counter |  |