| Param | Original file | Final file |
|---|---|---|
| Filename | modeM0/AS1A04_198T01_9000001708cztM0_level2_bc.evt | modeM0/AS1A04_198T01_9000001708cztM0_level2_quad_clean.evt |
| Size (bytes) | 3,669,955,200 | 983,589,120 |
| Size | 3.4 GB | 938.0 MB |
| Events in quadrant A | 35,649,558 | 6,056,341 |
| Events in quadrant B | 22,574,176 | 6,314,790 |
| Events in quadrant C | 15,875,210 | 6,262,375 |
| Events in quadrant D | 31,556,483 | 5,629,978 |
| Mode SS | |||
|---|---|---|---|
| Quadrant | BADHDUFLAG | Total packets | Discarded packets |
| A | 0 | 1642 | 0 |
| B | 0 | 1642 | 0 |
| C | 0 | 1642 | 0 |
| D | 0 | 1642 | 0 |
| Mode M9 | |||
|---|---|---|---|
| Quadrant | BADHDUFLAG | Total packets | Discarded packets |
| A | 0 | 120 | 0 |
| B | 0 | 120 | 0 |
| C | 0 | 120 | 0 |
| D | 0 | 120 | 0 |
| Mode M0 | |||
|---|---|---|---|
| Quadrant | BADHDUFLAG | Total packets | Discarded packets |
| A | 0 | 256043 | 0 |
| B | 0 | 191848 | 0 |
| C | 0 | 165478 | 0 |
| D | 0 | 246632 | 0 |
| Quadrant | Total seconds | Saturated seconds | Saturation percentage |
|---|---|---|---|
| A | 80571 | 8200 | 10.177359% |
| B | 80571 | 2720 | 3.375904% |
| C | 80571 | 637 | 0.790607% |
| D | 80571 | 9905 | 12.293505% |
Noise dominated data is calculated using 1-second bins in cleaned event files. If a bin has >2000 counts, and if more than 50% of those come from <1% of pixels, then it is considered to be noise-dominated and hence unusable.
| Quadrant | # 1 sec bins | Bins with >0 counts | Bins with >2000 counts | High rate bins dominated by noise | Noise dominated (total time) | Noise dominated (detector-on time) | Marked lightcurve |
|---|---|---|---|---|---|---|---|
| A | 92533 | 80575 | 808 | 808 | 0.87% | 1.00% | 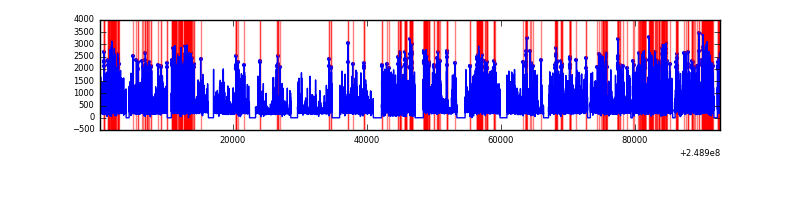 |
| B | 92533 | 80574 | 15 | 15 | 0.02% | 0.02% | 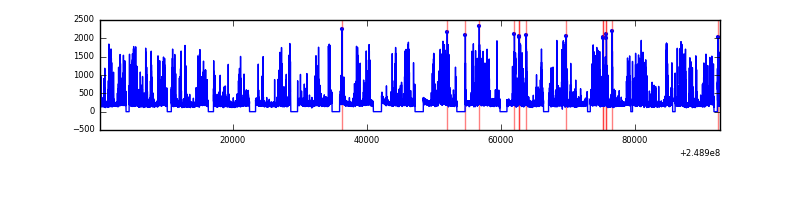 |
| C | 92533 | 80573 | 1 | 1 | 0.00% | 0.00% |  |
| D | 92533 | 80548 | 361 | 361 | 0.39% | 0.45% |  |
Top three noisy pixels from each quadrant. If the there are fewer than three noisy pixels in the level2.evt file, extra rows are filled as -1
| Pixel properties | Quadrant properties | ||||||
|---|---|---|---|---|---|---|---|
| Quadrant | DetID | PixID | Counts | Sigma | Mean | Median | Sigma |
| A | 8 | 5 | 18941416 | 21980.94 | 3932 | 3854 | 861.5 |
| A | 1 | 162 | 840997 | 971.68 | 3932 | 3854 | 861.5 |
| A | 13 | 251 | 212489 | 242.16 | 3932 | 3854 | 861.5 |
| B | 4 | 239 | 4708733 | 6068.44 | 4104 | 3995 | 775.3 |
| B | 3 | 64 | 613836 | 786.61 | 4104 | 3995 | 775.3 |
| B | 11 | 51 | 563885 | 722.18 | 4104 | 3995 | 775.3 |
| C | 8 | 128 | 27157 | 26.2 | 4039 | 3983 | 884.5 |
| C | 14 | 234 | 26813 | 25.81 | 4039 | 3983 | 884.5 |
| C | 13 | 61 | 24101 | 22.75 | 4039 | 3983 | 884.5 |
| D | 13 | 122 | 5718954 | 6439.57 | 3774 | 3632 | 887.5 |
| D | 13 | 152 | 4556934 | 5130.3 | 3774 | 3632 | 887.5 |
| D | 1 | 52 | 1984742 | 2232.16 | 3774 | 3632 | 887.5 |
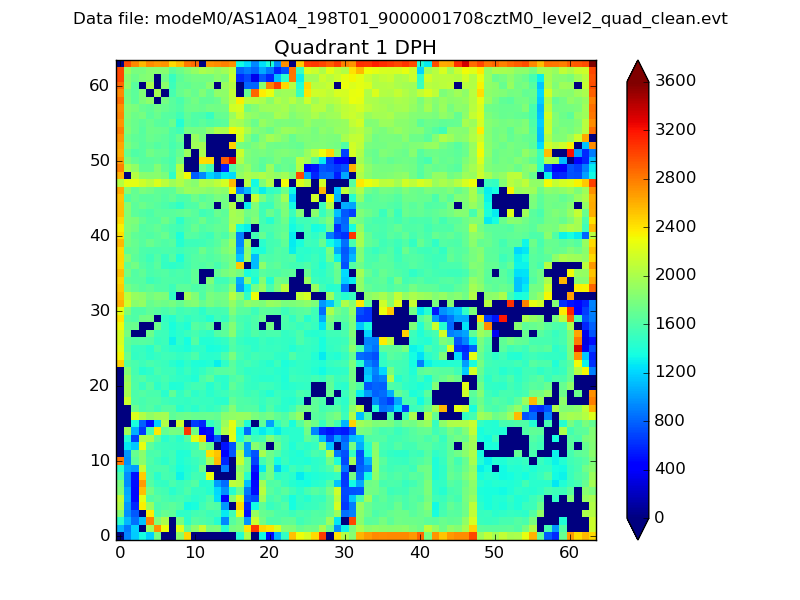
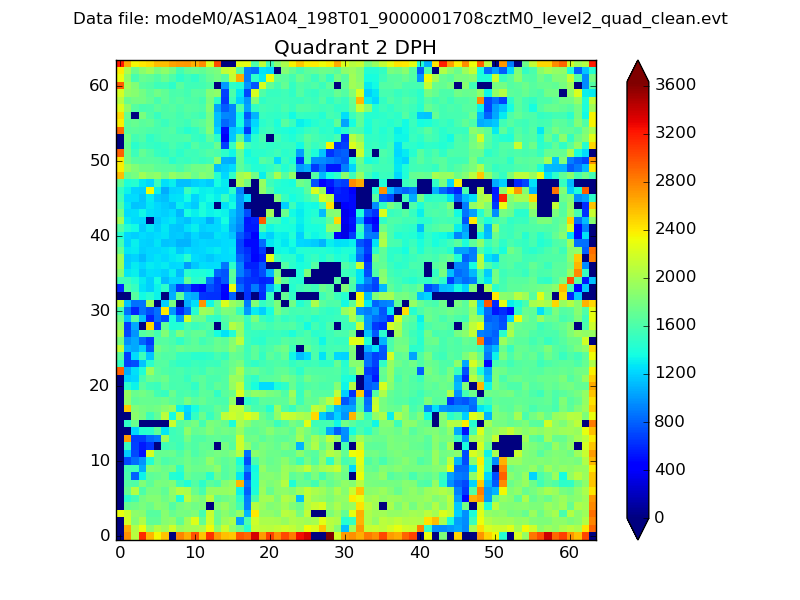
Histogram calculated using DETX and DETY for each event in the final _common_clean file
| Quadrant A |  |
 |
Quadrant B |
|---|---|---|---|
| Quadrant D |  |
 |
Quadrant C |
| Plot type | Count rate plots | Images |
|---|---|---|
| Comparison with Poisson distribution Blue bars denote a histogram of data divided into 1 sec bins. Red curve is a Poisson curve with rate = median count rate of data. |
 |
 |
| Quadrant-wise count rates Data is divided into 100 sec bins |
 |
|
| Module-wise count rates for Quadrant A Data is divided into 100 sec bins |
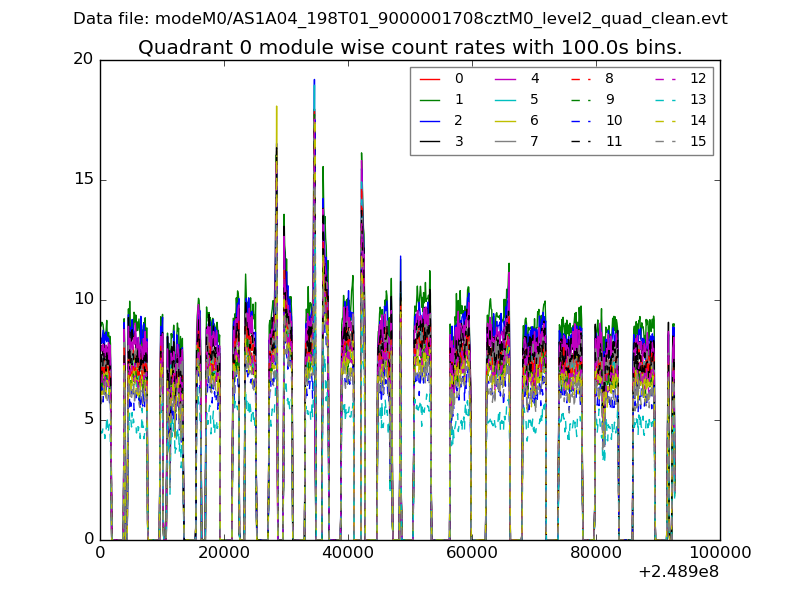 |
 |
| Module-wise count rates for Quadrant B Data is divided into 100 sec bins |
 |
 |
| Module-wise count rates for Quadrant C Data is divided into 100 sec bins |
 |
 |
| Module-wise count rates for Quadrant D Data is divided into 100 sec bins |
 |
 |
| Parameter | Plot |
|---|---|
| CZT HV Monitor |  |
| D_VDD |  |
| Temperature 1 |  |
| Veto HV Monitor |  |
| Veto LLD |  |
| Alpha Counter |  |
| _CPM_Rate |  |
| CZT Counter | 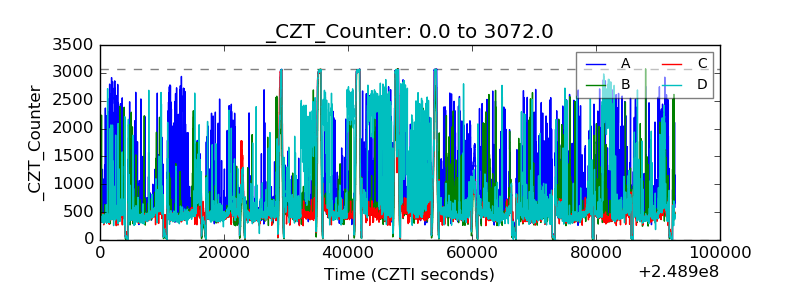 |
| +2.5 Volts monitor | 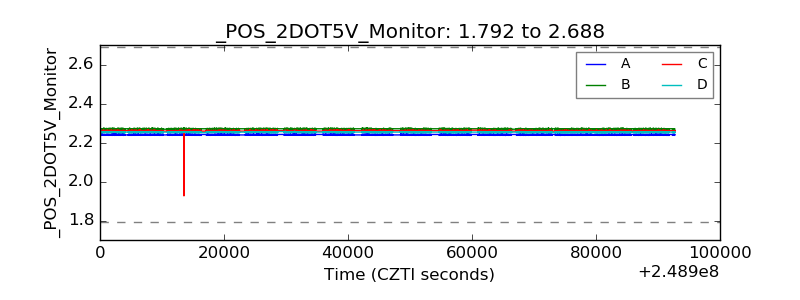 |
| +5 Volts monitor | 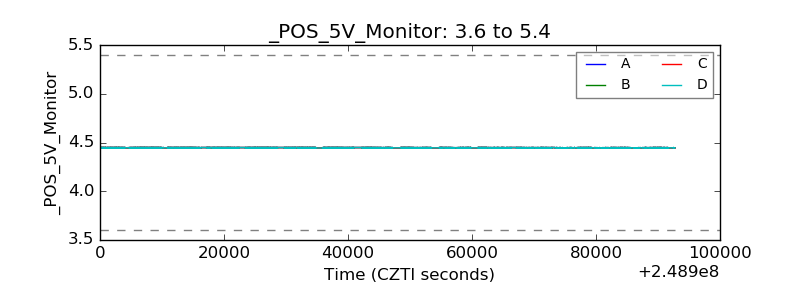 |
| _ROLL_ROT |  |
| _Roll_DEC |  |
| _Roll_RA |  |
| Veto Counter |  |