| Param | Original file | Final file |
|---|---|---|
| Filename | modeM0/AS1C03_020T01_9000001706cztM0_level2_bc.evt | modeM0/AS1C03_020T01_9000001706cztM0_level2_quad_clean.evt |
| Size (bytes) | 3,532,510,080 | 851,618,880 |
| Size | 3.3 GB | 812.2 MB |
| Events in quadrant A | 40,134,159 | 5,042,321 |
| Events in quadrant B | 26,213,875 | 5,381,523 |
| Events in quadrant C | 13,423,687 | 5,514,879 |
| Events in quadrant D | 22,583,185 | 5,190,602 |
| Mode M0 | |||
|---|---|---|---|
| Quadrant | BADHDUFLAG | Total packets | Discarded packets |
| A | 0 | 266875 | 0 |
| B | 0 | 193623 | 0 |
| C | 0 | 140025 | 0 |
| D | 0 | 178914 | 0 |
| Mode M9 | |||
|---|---|---|---|
| Quadrant | BADHDUFLAG | Total packets | Discarded packets |
| A | 0 | 113 | 0 |
| B | 0 | 113 | 0 |
| C | 0 | 113 | 0 |
| D | 0 | 113 | 0 |
| Mode SS | |||
|---|---|---|---|
| Quadrant | BADHDUFLAG | Total packets | Discarded packets |
| A | 0 | 1382 | 0 |
| B | 0 | 1382 | 0 |
| C | 0 | 1382 | 0 |
| D | 0 | 1382 | 0 |
| Quadrant | Total seconds | Saturated seconds | Saturation percentage |
|---|---|---|---|
| A | 67966 | 13537 | 19.917312% |
| B | 67966 | 5091 | 7.490510% |
| C | 67966 | 521 | 0.766560% |
| D | 67966 | 3416 | 5.026042% |
Noise dominated data is calculated using 1-second bins in cleaned event files. If a bin has >2000 counts, and if more than 50% of those come from <1% of pixels, then it is considered to be noise-dominated and hence unusable.
| Quadrant | # 1 sec bins | Bins with >0 counts | Bins with >2000 counts | High rate bins dominated by noise | Noise dominated (total time) | Noise dominated (detector-on time) | Marked lightcurve |
|---|---|---|---|---|---|---|---|
| A | 79167 | 67966 | 1012 | 1012 | 1.28% | 1.49% |  |
| B | 79167 | 67966 | 140 | 140 | 0.18% | 0.21% | 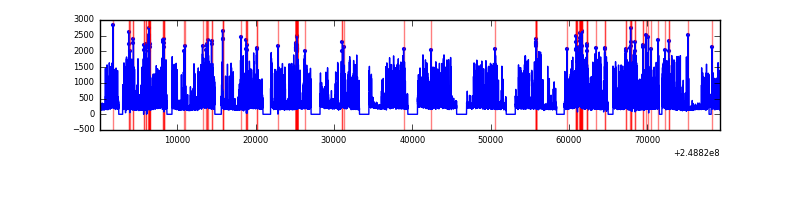 |
| C | 79167 | 67968 | 0 | 0 | 0.00% | 0.00% |  |
| D | 79167 | 67960 | 371 | 371 | 0.47% | 0.55% |  |
Top three noisy pixels from each quadrant. If the there are fewer than three noisy pixels in the level2.evt file, extra rows are filled as -1
| Pixel properties | Quadrant properties | ||||||
|---|---|---|---|---|---|---|---|
| Quadrant | DetID | PixID | Counts | Sigma | Mean | Median | Sigma |
| A | 8 | 5 | 26406486 | 37643.89 | 3206 | 3146 | 701.4 |
| A | 1 | 162 | 720205 | 1022.33 | 3206 | 3146 | 701.4 |
| A | 1 | 178 | 108355 | 150.0 | 3206 | 3146 | 701.4 |
| B | 4 | 239 | 7552281 | 11673.88 | 3441 | 3348 | 646.7 |
| B | 10 | 16 | 2685535 | 4147.81 | 3441 | 3348 | 646.7 |
| B | 3 | 64 | 708455 | 1090.4 | 3441 | 3348 | 646.7 |
| C | 12 | 4 | 28318 | 33.61 | 3415 | 3368 | 742.4 |
| C | 13 | 61 | 20493 | 23.07 | 3415 | 3368 | 742.4 |
| C | 14 | 234 | 19995 | 22.4 | 3415 | 3368 | 742.4 |
| D | 1 | 52 | 6281446 | 8064.75 | 3361 | 3235 | 778.5 |
| D | 13 | 122 | 949160 | 1215.1 | 3361 | 3235 | 778.5 |
| D | 13 | 104 | 559764 | 714.9 | 3361 | 3235 | 778.5 |
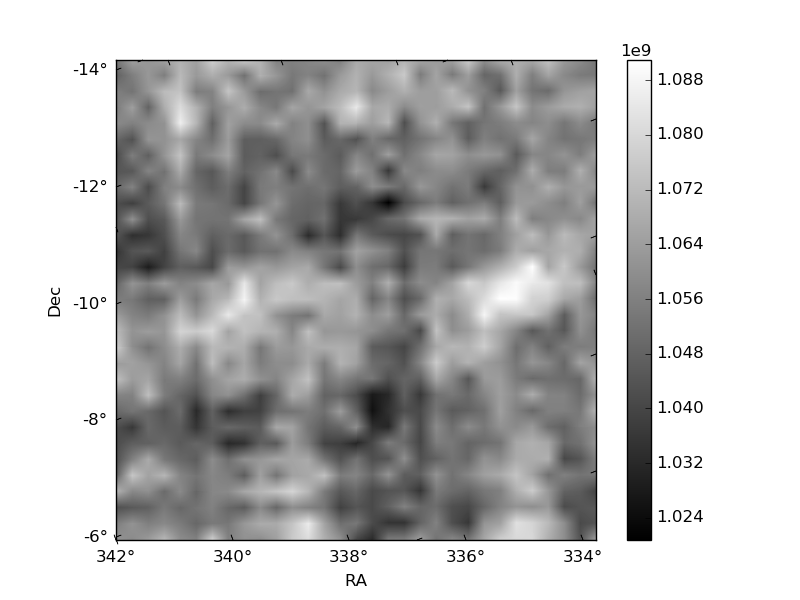
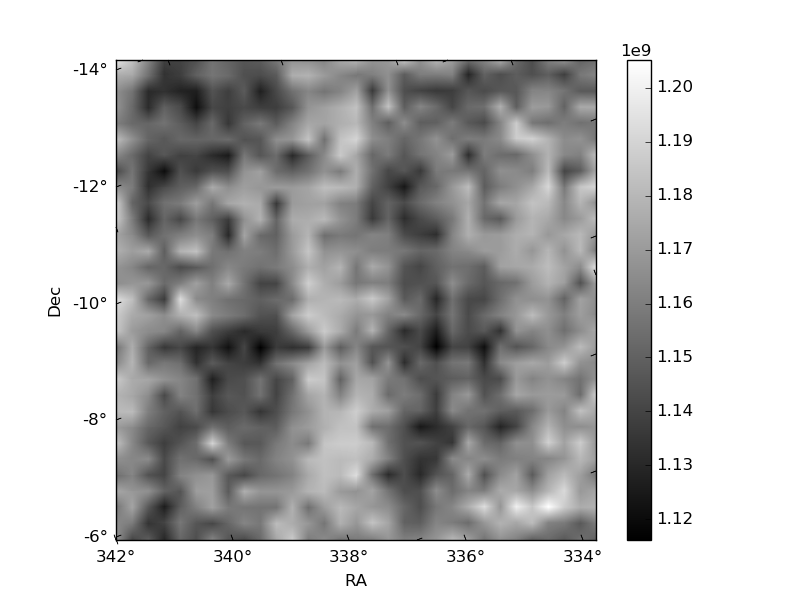
Histogram calculated using DETX and DETY for each event in the final _common_clean file
| Quadrant A | 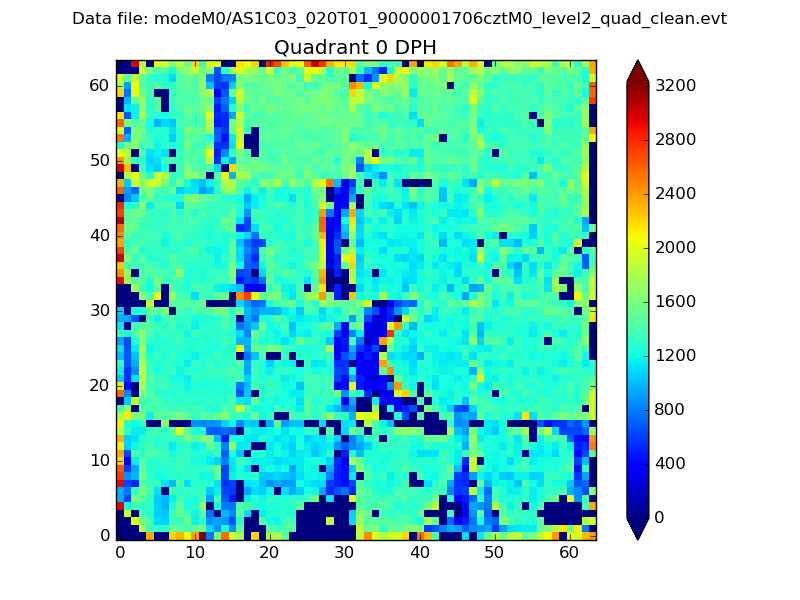 |
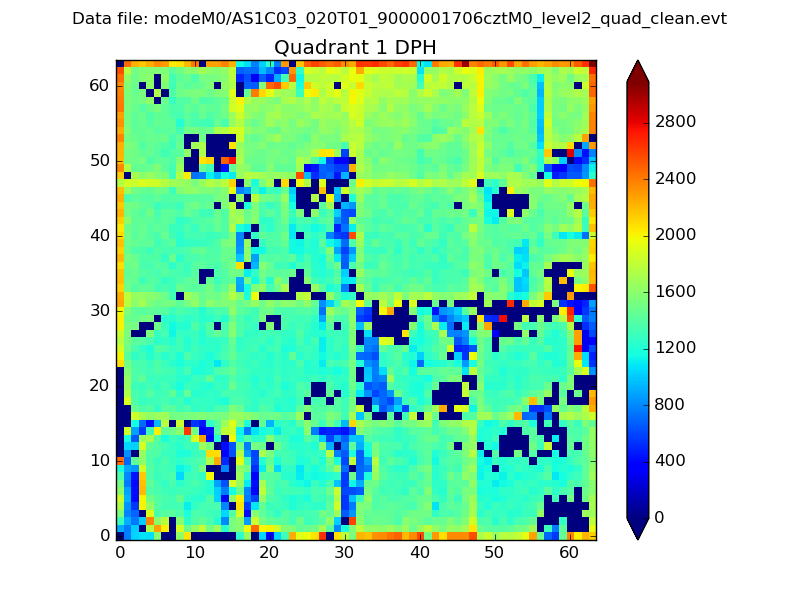 |
Quadrant B |
|---|---|---|---|
| Quadrant D |  |
 |
Quadrant C |
| Plot type | Count rate plots | Images |
|---|---|---|
| Comparison with Poisson distribution Blue bars denote a histogram of data divided into 1 sec bins. Red curve is a Poisson curve with rate = median count rate of data. |
 |
 |
| Quadrant-wise count rates Data is divided into 100 sec bins |
 |
|
| Module-wise count rates for Quadrant A Data is divided into 100 sec bins |
 |
 |
| Module-wise count rates for Quadrant B Data is divided into 100 sec bins |
 |
 |
| Module-wise count rates for Quadrant C Data is divided into 100 sec bins |
 |
 |
| Module-wise count rates for Quadrant D Data is divided into 100 sec bins |
 |
 |
| Parameter | Plot |
|---|---|
| CZT HV Monitor | 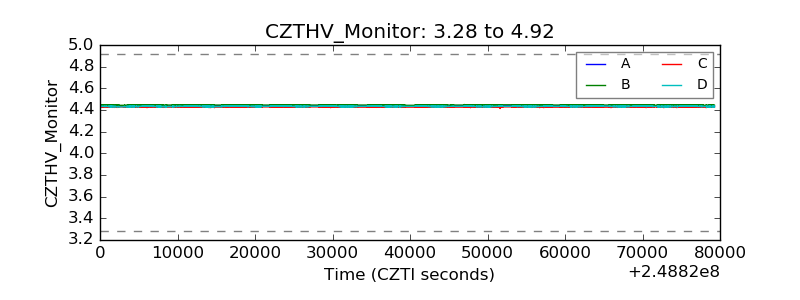 |
| D_VDD |  |
| Temperature 1 |  |
| Veto HV Monitor |  |
| Veto LLD | 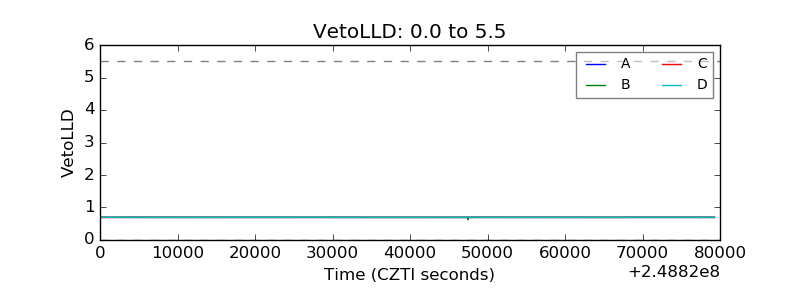 |
| Alpha Counter |  |
| _CPM_Rate |  |
| CZT Counter |  |
| +2.5 Volts monitor |  |
| +5 Volts monitor |  |
| _ROLL_ROT |  |
| _Roll_DEC |  |
| _Roll_RA |  |
| Veto Counter |  |