| Param | Original file | Final file |
|---|---|---|
| Filename | modeM0/AS1A04_130T04_9000001704cztM0_level2_bc.evt | modeM0/AS1A04_130T04_9000001704cztM0_level2_quad_clean.evt |
| Size (bytes) | 2,373,137,280 | 490,556,160 |
| Size | 2.2 GB | 467.8 MB |
| Events in quadrant A | 28,956,793 | 2,813,767 |
| Events in quadrant B | 15,275,958 | 3,142,922 |
| Events in quadrant C | 7,948,768 | 3,154,372 |
| Events in quadrant D | 16,945,049 | 2,977,180 |
| Mode M0 | |||
|---|---|---|---|
| Quadrant | BADHDUFLAG | Total packets | Discarded packets |
| A | 0 | 171842 | 0 |
| B | 0 | 113574 | 0 |
| C | 0 | 82469 | 0 |
| D | 0 | 112540 | 0 |
| Mode M9 | |||
|---|---|---|---|
| Quadrant | BADHDUFLAG | Total packets | Discarded packets |
| A | 0 | 62 | 0 |
| B | 0 | 62 | 0 |
| C | 0 | 62 | 0 |
| D | 0 | 62 | 0 |
| Mode SS | |||
|---|---|---|---|
| Quadrant | BADHDUFLAG | Total packets | Discarded packets |
| A | 0 | 822 | 0 |
| B | 0 | 822 | 0 |
| C | 0 | 822 | 0 |
| D | 0 | 822 | 0 |
| Quadrant | Total seconds | Saturated seconds | Saturation percentage |
|---|---|---|---|
| A | 40281 | 9658 | 23.976565% |
| B | 40281 | 3007 | 7.465058% |
| C | 40281 | 380 | 0.943373% |
| D | 40281 | 2711 | 6.730220% |
Noise dominated data is calculated using 1-second bins in cleaned event files. If a bin has >2000 counts, and if more than 50% of those come from <1% of pixels, then it is considered to be noise-dominated and hence unusable.
| Quadrant | # 1 sec bins | Bins with >0 counts | Bins with >2000 counts | High rate bins dominated by noise | Noise dominated (total time) | Noise dominated (detector-on time) | Marked lightcurve |
|---|---|---|---|---|---|---|---|
| A | 45841 | 40281 | 960 | 960 | 2.09% | 2.38% |  |
| B | 45841 | 40281 | 52 | 52 | 0.11% | 0.13% | 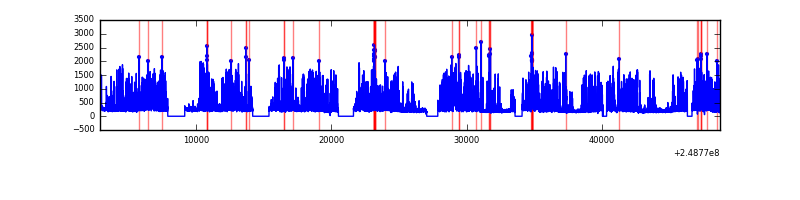 |
| C | 45841 | 40283 | 0 | 0 | 0.00% | 0.00% | 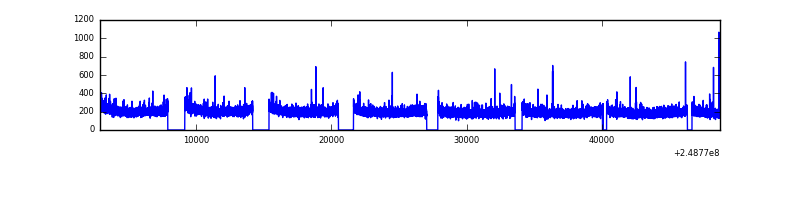 |
| D | 45841 | 40282 | 118 | 118 | 0.26% | 0.29% |  |
Top three noisy pixels from each quadrant. If the there are fewer than three noisy pixels in the level2.evt file, extra rows are filled as -1
| Pixel properties | Quadrant properties | ||||||
|---|---|---|---|---|---|---|---|
| Quadrant | DetID | PixID | Counts | Sigma | Mean | Median | Sigma |
| A | 8 | 5 | 20938008 | 51639.84 | 1864 | 1830 | 405.4 |
| A | 1 | 162 | 474290 | 1165.34 | 1864 | 1830 | 405.4 |
| A | 1 | 178 | 70791 | 170.09 | 1864 | 1830 | 405.4 |
| B | 4 | 239 | 4504919 | 11649.18 | 2035 | 1981 | 386.5 |
| B | 3 | 64 | 1494264 | 3860.56 | 2035 | 1981 | 386.5 |
| B | 11 | 51 | 417306 | 1074.45 | 2035 | 1981 | 386.5 |
| C | 12 | 4 | 16384 | 32.64 | 2022 | 1990 | 441.0 |
| C | 13 | 61 | 12271 | 23.31 | 2022 | 1990 | 441.0 |
| C | 9 | 54 | 11078 | 20.6 | 2022 | 1990 | 441.0 |
| D | 13 | 122 | 4129039 | 8874.12 | 2013 | 1942 | 465.1 |
| D | 1 | 52 | 2001912 | 4300.35 | 2013 | 1942 | 465.1 |
| D | 8 | 195 | 1369278 | 2940.06 | 2013 | 1942 | 465.1 |
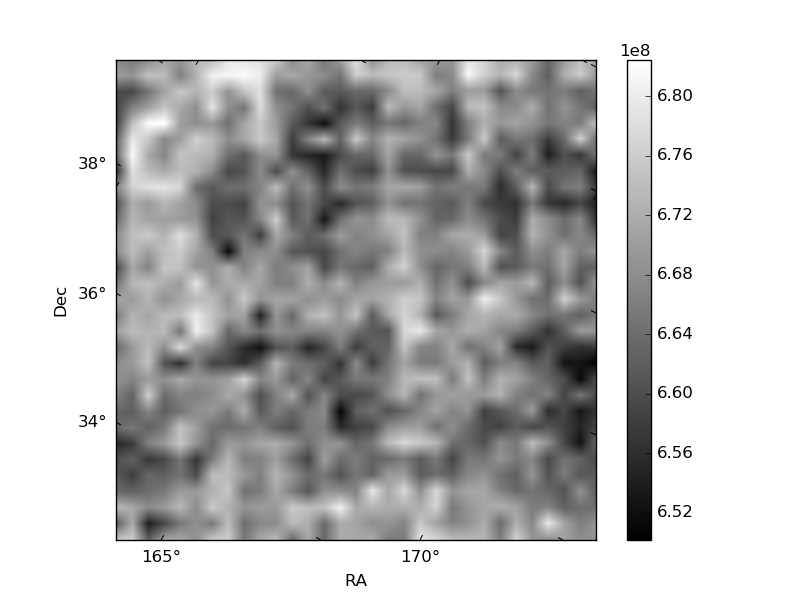
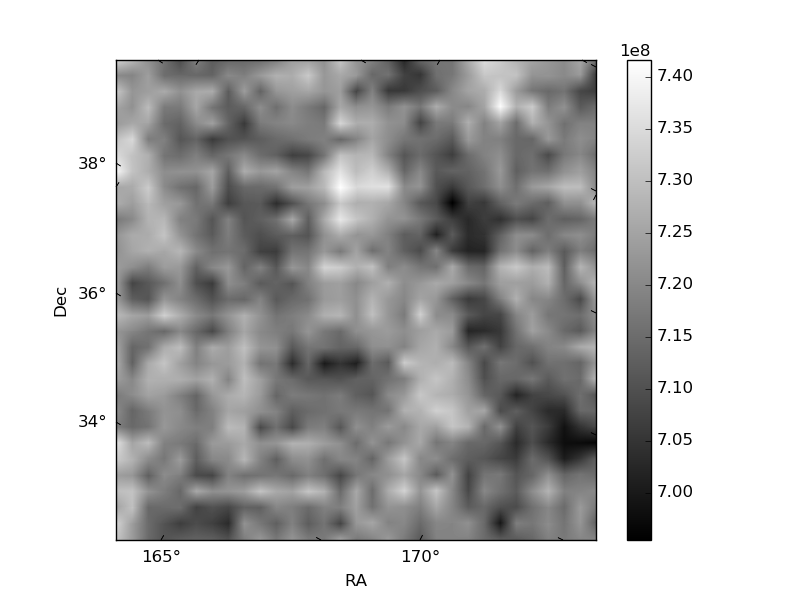
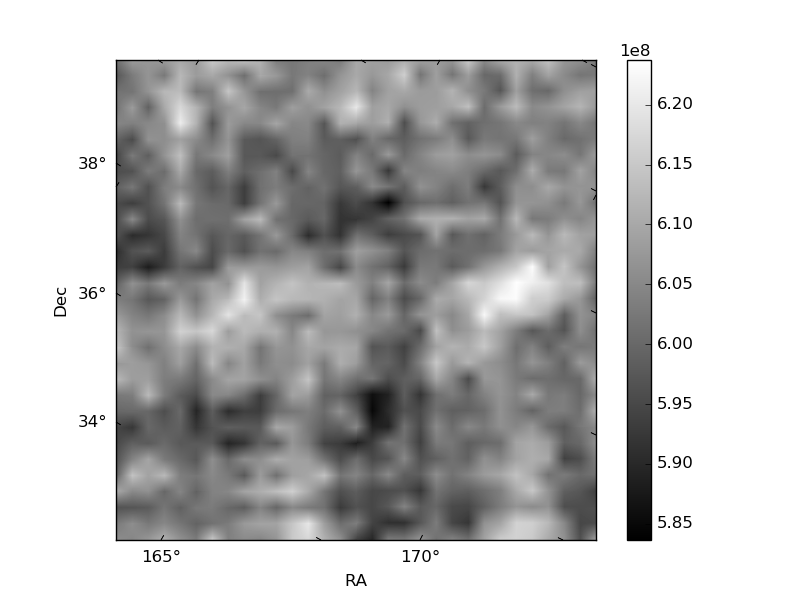
Histogram calculated using DETX and DETY for each event in the final _common_clean file
| Quadrant A | 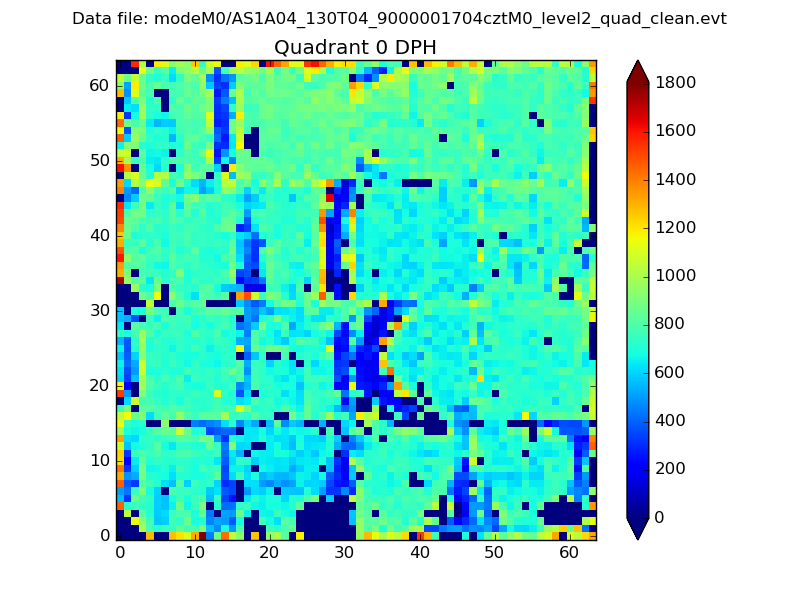 |
 |
Quadrant B |
|---|---|---|---|
| Quadrant D | 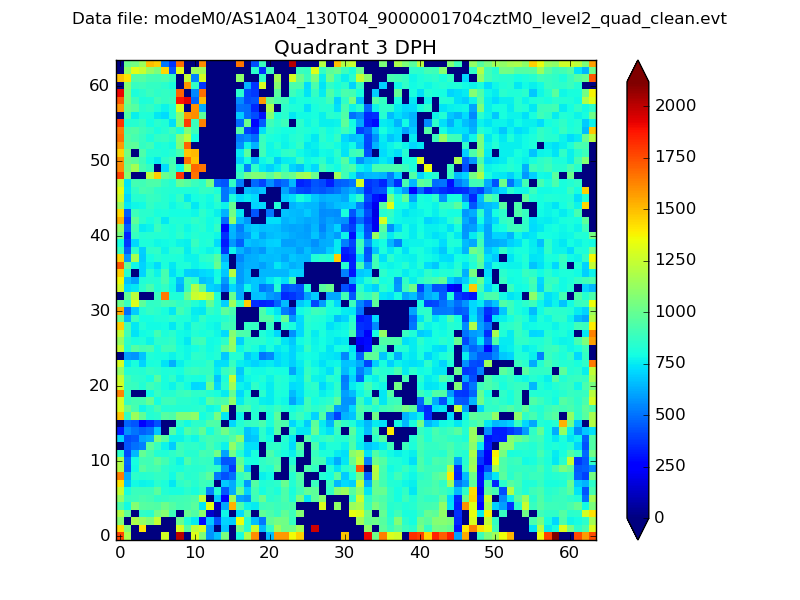 |
 |
Quadrant C |
| Plot type | Count rate plots | Images |
|---|---|---|
| Comparison with Poisson distribution Blue bars denote a histogram of data divided into 1 sec bins. Red curve is a Poisson curve with rate = median count rate of data. |
 |
 |
| Quadrant-wise count rates Data is divided into 100 sec bins |
 |
|
| Module-wise count rates for Quadrant A Data is divided into 100 sec bins |
 |
 |
| Module-wise count rates for Quadrant B Data is divided into 100 sec bins |
 |
 |
| Module-wise count rates for Quadrant C Data is divided into 100 sec bins |
 |
 |
| Module-wise count rates for Quadrant D Data is divided into 100 sec bins |
 |
 |
| Parameter | Plot |
|---|---|
| CZT HV Monitor |  |
| D_VDD | 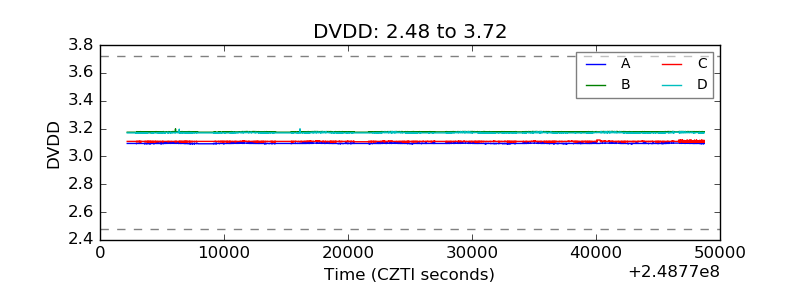 |
| Temperature 1 |  |
| Veto HV Monitor |  |
| Veto LLD |  |
| Alpha Counter |  |
| _CPM_Rate | 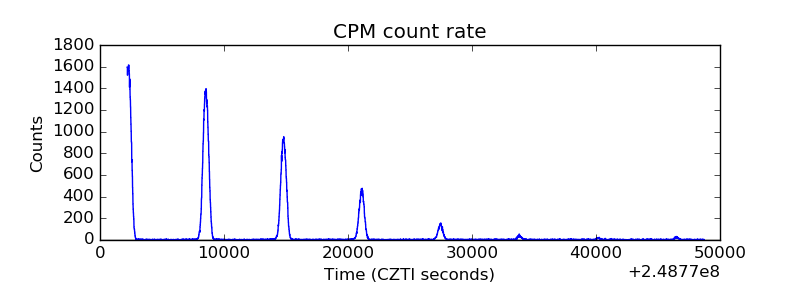 |
| CZT Counter | 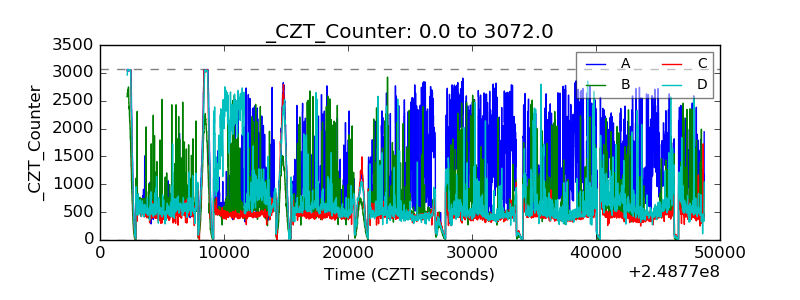 |
| +2.5 Volts monitor |  |
| +5 Volts monitor | 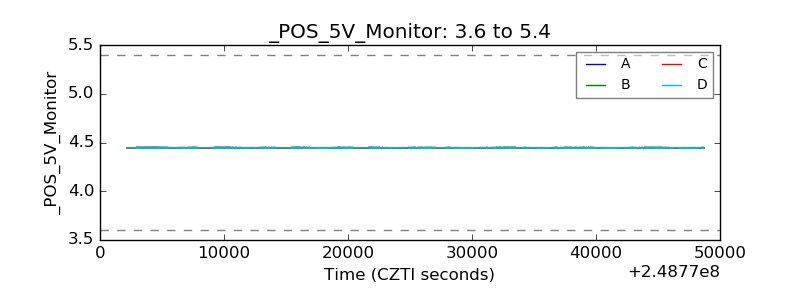 |
| _ROLL_ROT |  |
| _Roll_DEC |  |
| _Roll_RA |  |
| Veto Counter |  |