| Param | Original file | Final file |
|---|---|---|
| Filename | modeM0/AS1G08_031T01_9000001702cztM0_level2_bc.evt | modeM0/AS1G08_031T01_9000001702cztM0_level2_quad_clean.evt |
| Size (bytes) | 1,870,413,120 | 520,099,200 |
| Size | 1.7 GB | 496.0 MB |
| Events in quadrant A | 14,105,170 | 3,194,578 |
| Events in quadrant B | 13,968,773 | 3,197,145 |
| Events in quadrant C | 8,779,012 | 3,222,766 |
| Events in quadrant D | 16,647,165 | 2,970,467 |
| Mode SS | |||
|---|---|---|---|
| Quadrant | BADHDUFLAG | Total packets | Discarded packets |
| A | 0 | 944 | 0 |
| B | 0 | 944 | 0 |
| C | 0 | 944 | 0 |
| D | 0 | 944 | 0 |
| Mode M9 | |||
|---|---|---|---|
| Quadrant | BADHDUFLAG | Total packets | Discarded packets |
| A | 0 | 53 | 0 |
| B | 0 | 53 | 0 |
| C | 0 | 53 | 0 |
| D | 0 | 53 | 0 |
| Mode M0 | |||
|---|---|---|---|
| Quadrant | BADHDUFLAG | Total packets | Discarded packets |
| A | 0 | 119446 | 0 |
| B | 0 | 114822 | 0 |
| C | 0 | 94070 | 0 |
| D | 0 | 121535 | 0 |
| Quadrant | Total seconds | Saturated seconds | Saturation percentage |
|---|---|---|---|
| A | 46118 | 1617 | 3.506223% |
| B | 46118 | 1958 | 4.245631% |
| C | 46118 | 176 | 0.381630% |
| D | 46118 | 2751 | 5.965133% |
Noise dominated data is calculated using 1-second bins in cleaned event files. If a bin has >2000 counts, and if more than 50% of those come from <1% of pixels, then it is considered to be noise-dominated and hence unusable.
| Quadrant | # 1 sec bins | Bins with >0 counts | Bins with >2000 counts | High rate bins dominated by noise | Noise dominated (total time) | Noise dominated (detector-on time) | Marked lightcurve |
|---|---|---|---|---|---|---|---|
| A | 51539 | 46120 | 17 | 17 | 0.03% | 0.04% |  |
| B | 51539 | 46120 | 43 | 43 | 0.08% | 0.09% |  |
| C | 51539 | 46121 | 1 | 1 | 0.00% | 0.00% |  |
| D | 51539 | 46118 | 819 | 819 | 1.59% | 1.78% |  |
Top three noisy pixels from each quadrant. If the there are fewer than three noisy pixels in the level2.evt file, extra rows are filled as -1
| Pixel properties | Quadrant properties | ||||||
|---|---|---|---|---|---|---|---|
| Quadrant | DetID | PixID | Counts | Sigma | Mean | Median | Sigma |
| A | 8 | 5 | 4629631 | 9491.83 | 2240 | 2193 | 487.5 |
| A | 1 | 162 | 499723 | 1020.54 | 2240 | 2193 | 487.5 |
| A | 1 | 178 | 73159 | 145.57 | 2240 | 2193 | 487.5 |
| B | 4 | 239 | 3155885 | 7323.02 | 2264 | 2198 | 430.7 |
| B | 3 | 64 | 1035811 | 2400.1 | 2264 | 2198 | 430.7 |
| B | 11 | 51 | 315471 | 727.44 | 2264 | 2198 | 430.7 |
| C | 9 | 54 | 47294 | 92.37 | 2227 | 2187 | 488.3 |
| C | 13 | 61 | 13204 | 22.56 | 2227 | 2187 | 488.3 |
| C | 12 | 4 | 12445 | 21.01 | 2227 | 2187 | 488.3 |
| D | 1 | 52 | 6374467 | 12385.21 | 2172 | 2091 | 514.5 |
| D | 8 | 195 | 315070 | 608.3 | 2172 | 2091 | 514.5 |
| D | 10 | 199 | 291151 | 561.81 | 2172 | 2091 | 514.5 |
Histogram calculated using DETX and DETY for each event in the final _common_clean file
| Quadrant A |  |
 |
Quadrant B |
|---|---|---|---|
| Quadrant D | 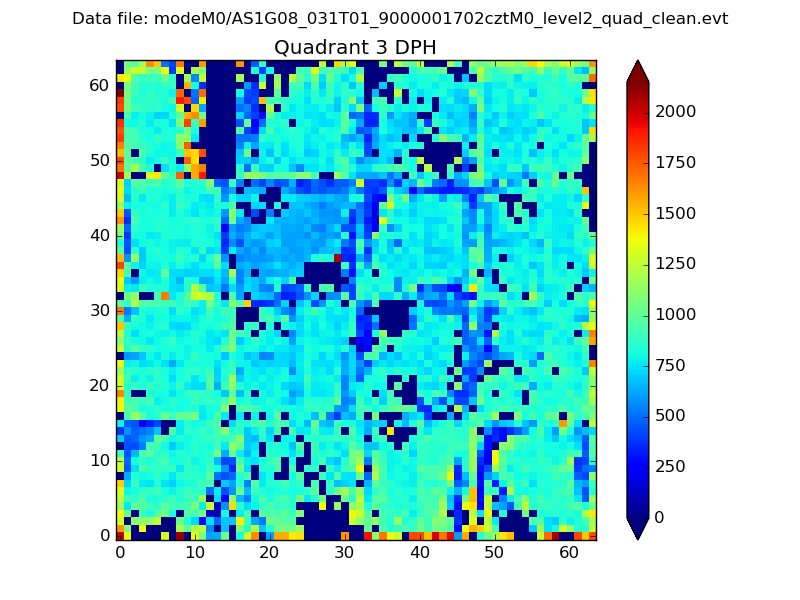 |
 |
Quadrant C |
| Plot type | Count rate plots | Images |
|---|---|---|
| Comparison with Poisson distribution Blue bars denote a histogram of data divided into 1 sec bins. Red curve is a Poisson curve with rate = median count rate of data. |
 |
 |
| Quadrant-wise count rates Data is divided into 100 sec bins |
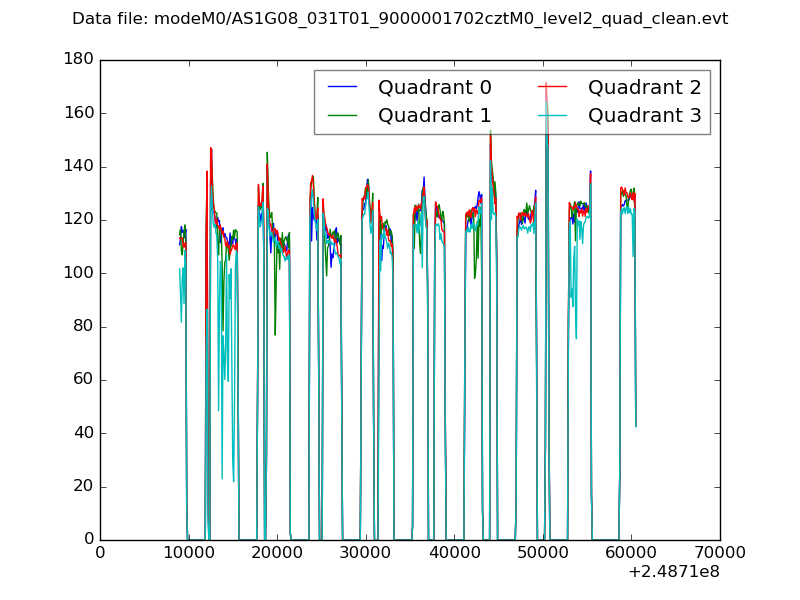 |
|
| Module-wise count rates for Quadrant A Data is divided into 100 sec bins |
 |
 |
| Module-wise count rates for Quadrant B Data is divided into 100 sec bins |
 |
 |
| Module-wise count rates for Quadrant C Data is divided into 100 sec bins |
 |
 |
| Module-wise count rates for Quadrant D Data is divided into 100 sec bins |
 |
 |
| Parameter | Plot |
|---|---|
| CZT HV Monitor |  |
| D_VDD |  |
| Temperature 1 |  |
| Veto HV Monitor |  |
| Veto LLD |  |
| Alpha Counter |  |
| _CPM_Rate |  |
| CZT Counter |  |
| +2.5 Volts monitor |  |
| +5 Volts monitor |  |
| _ROLL_ROT |  |
| _Roll_DEC |  |
| _Roll_RA |  |
| Veto Counter |  |