| Param | Original file | Final file |
|---|---|---|
| Filename | modeM0/AS1A04_137T01_9000001700cztM0_level2_bc.evt | modeM0/AS1A04_137T01_9000001700cztM0_level2_quad_clean.evt |
| Size (bytes) | 2,049,903,360 | 559,736,640 |
| Size | 1.9 GB | 533.8 MB |
| Events in quadrant A | 17,606,736 | 3,514,937 |
| Events in quadrant B | 17,917,316 | 3,445,498 |
| Events in quadrant C | 8,615,513 | 3,692,122 |
| Events in quadrant D | 15,101,884 | 3,437,100 |
| Mode M0 | |||
|---|---|---|---|
| Quadrant | BADHDUFLAG | Total packets | Discarded packets |
| A | 0 | 127705 | 0 |
| B | 0 | 126663 | 0 |
| C | 0 | 86250 | 0 |
| D | 0 | 109185 | 0 |
| Mode M9 | |||
|---|---|---|---|
| Quadrant | BADHDUFLAG | Total packets | Discarded packets |
| A | 0 | 86 | 0 |
| B | 0 | 86 | 0 |
| C | 0 | 86 | 0 |
| D | 0 | 86 | 0 |
| Mode SS | |||
|---|---|---|---|
| Quadrant | BADHDUFLAG | Total packets | Discarded packets |
| A | 0 | 850 | 0 |
| B | 0 | 850 | 0 |
| C | 0 | 850 | 0 |
| D | 0 | 850 | 0 |
| Quadrant | Total seconds | Saturated seconds | Saturation percentage |
|---|---|---|---|
| A | 41682 | 3133 | 7.516434% |
| B | 41682 | 4290 | 10.292212% |
| C | 41682 | 399 | 0.957248% |
| D | 41682 | 2206 | 5.292452% |
Noise dominated data is calculated using 1-second bins in cleaned event files. If a bin has >2000 counts, and if more than 50% of those come from <1% of pixels, then it is considered to be noise-dominated and hence unusable.
| Quadrant | # 1 sec bins | Bins with >0 counts | Bins with >2000 counts | High rate bins dominated by noise | Noise dominated (total time) | Noise dominated (detector-on time) | Marked lightcurve |
|---|---|---|---|---|---|---|---|
| A | 50308 | 41681 | 105 | 105 | 0.21% | 0.25% |  |
| B | 50308 | 41683 | 291 | 291 | 0.58% | 0.70% |  |
| C | 50308 | 41685 | 0 | 0 | 0.00% | 0.00% |  |
| D | 50308 | 41684 | 425 | 425 | 0.84% | 1.02% | 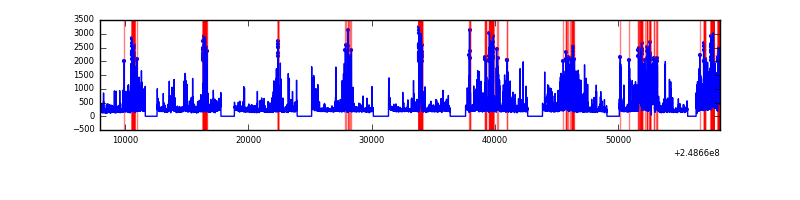 |
Top three noisy pixels from each quadrant. If the there are fewer than three noisy pixels in the level2.evt file, extra rows are filled as -1
| Pixel properties | Quadrant properties | ||||||
|---|---|---|---|---|---|---|---|
| Quadrant | DetID | PixID | Counts | Sigma | Mean | Median | Sigma |
| A | 8 | 5 | 8365135 | 17973.46 | 2164 | 2125 | 465.3 |
| A | 9 | 143 | 344550 | 735.93 | 2164 | 2125 | 465.3 |
| A | 1 | 162 | 214970 | 457.44 | 2164 | 2125 | 465.3 |
| B | 4 | 239 | 4435435 | 11070.39 | 2152 | 2102 | 400.5 |
| B | 3 | 64 | 2602257 | 6492.8 | 2152 | 2102 | 400.5 |
| B | 15 | 255 | 1262436 | 3147.16 | 2152 | 2102 | 400.5 |
| C | 9 | 54 | 22655 | 43.1 | 2183 | 2158 | 475.6 |
| C | 12 | 4 | 20606 | 38.79 | 2183 | 2158 | 475.6 |
| C | 14 | 234 | 18735 | 34.85 | 2183 | 2158 | 475.6 |
| D | 10 | 253 | 1930057 | 3900.48 | 2164 | 2090 | 494.3 |
| D | 2 | 33 | 1488930 | 3008.04 | 2164 | 2090 | 494.3 |
| D | 1 | 52 | 954163 | 1926.15 | 2164 | 2090 | 494.3 |
Histogram calculated using DETX and DETY for each event in the final _common_clean file
| Quadrant A |  |
 |
Quadrant B |
|---|---|---|---|
| Quadrant D | 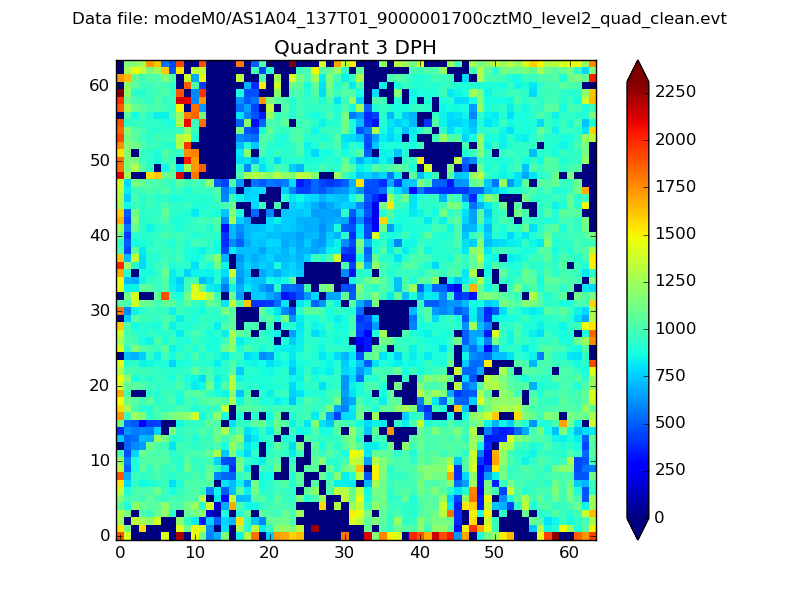 |
 |
Quadrant C |
| Plot type | Count rate plots | Images |
|---|---|---|
| Comparison with Poisson distribution Blue bars denote a histogram of data divided into 1 sec bins. Red curve is a Poisson curve with rate = median count rate of data. |
 |
 |
| Quadrant-wise count rates Data is divided into 100 sec bins |
 |
|
| Module-wise count rates for Quadrant A Data is divided into 100 sec bins |
 |
 |
| Module-wise count rates for Quadrant B Data is divided into 100 sec bins |
 |
 |
| Module-wise count rates for Quadrant C Data is divided into 100 sec bins |
 |
 |
| Module-wise count rates for Quadrant D Data is divided into 100 sec bins |
 |
 |
| Parameter | Plot |
|---|---|
| CZT HV Monitor |  |
| D_VDD |  |
| Temperature 1 |  |
| Veto HV Monitor |  |
| Veto LLD |  |
| Alpha Counter |  |
| _CPM_Rate |  |
| CZT Counter |  |
| +2.5 Volts monitor |  |
| +5 Volts monitor | 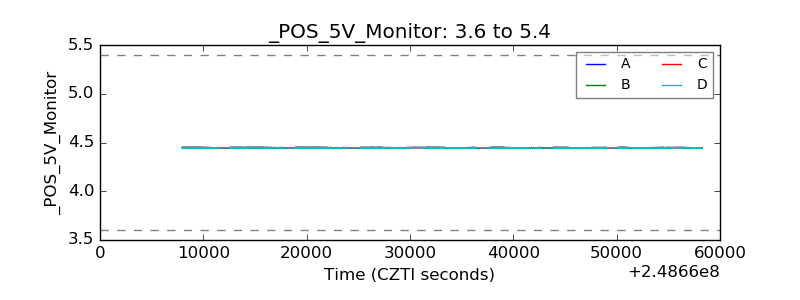 |
| _ROLL_ROT |  |
| _Roll_DEC |  |
| _Roll_RA | 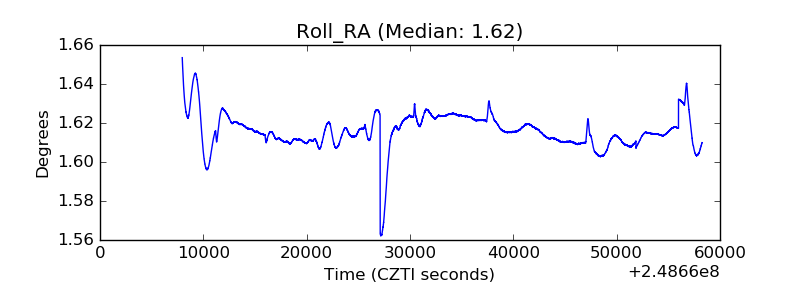 |
| Veto Counter |  |