| Param | Original file | Final file |
|---|---|---|
| Filename | modeM0/AS1A04_112T01_9000001698cztM0_level2_bc.evt | modeM0/AS1A04_112T01_9000001698cztM0_level2_quad_clean.evt |
| Size (bytes) | 2,149,436,160 | 629,285,760 |
| Size | 2.0 GB | 600.1 MB |
| Events in quadrant A | 22,851,383 | 3,890,125 |
| Events in quadrant B | 17,367,812 | 4,031,396 |
| Events in quadrant C | 8,813,321 | 4,050,430 |
| Events in quadrant D | 12,896,210 | 3,897,531 |
| Mode M0 | |||
|---|---|---|---|
| Quadrant | BADHDUFLAG | Total packets | Discarded packets |
| A | 0 | 152615 | 0 |
| B | 0 | 131492 | 0 |
| C | 0 | 94792 | 0 |
| D | 0 | 109109 | 0 |
| Mode M9 | |||
|---|---|---|---|
| Quadrant | BADHDUFLAG | Total packets | Discarded packets |
| A | 0 | 64 | 0 |
| B | 0 | 64 | 0 |
| C | 0 | 64 | 0 |
| D | 0 | 64 | 0 |
| Mode SS | |||
|---|---|---|---|
| Quadrant | BADHDUFLAG | Total packets | Discarded packets |
| A | 0 | 944 | 0 |
| B | 0 | 944 | 0 |
| C | 0 | 944 | 0 |
| D | 0 | 944 | 0 |
| Quadrant | Total seconds | Saturated seconds | Saturation percentage |
|---|---|---|---|
| A | 46475 | 5161 | 11.104895% |
| B | 46475 | 4026 | 8.662722% |
| C | 46475 | 412 | 0.886498% |
| D | 46475 | 1195 | 2.571275% |
Noise dominated data is calculated using 1-second bins in cleaned event files. If a bin has >2000 counts, and if more than 50% of those come from <1% of pixels, then it is considered to be noise-dominated and hence unusable.
| Quadrant | # 1 sec bins | Bins with >0 counts | Bins with >2000 counts | High rate bins dominated by noise | Noise dominated (total time) | Noise dominated (detector-on time) | Marked lightcurve |
|---|---|---|---|---|---|---|---|
| A | 52721 | 46472 | 533 | 533 | 1.01% | 1.15% |  |
| B | 52721 | 46476 | 69 | 69 | 0.13% | 0.15% |  |
| C | 52721 | 46478 | 0 | 0 | 0.00% | 0.00% |  |
| D | 52721 | 46476 | 111 | 111 | 0.21% | 0.24% |  |
Top three noisy pixels from each quadrant. If the there are fewer than three noisy pixels in the level2.evt file, extra rows are filled as -1
| Pixel properties | Quadrant properties | ||||||
|---|---|---|---|---|---|---|---|
| Quadrant | DetID | PixID | Counts | Sigma | Mean | Median | Sigma |
| A | 8 | 5 | 13415411 | 28322.12 | 2165 | 2126 | 473.6 |
| A | 1 | 162 | 439607 | 923.74 | 2165 | 2126 | 473.6 |
| A | 15 | 174 | 244273 | 511.29 | 2165 | 2126 | 473.6 |
| B | 4 | 239 | 5755545 | 13461.02 | 2231 | 2172 | 427.4 |
| B | 3 | 64 | 951163 | 2220.33 | 2231 | 2172 | 427.4 |
| B | 15 | 204 | 746108 | 1740.57 | 2231 | 2172 | 427.4 |
| C | 0 | 10 | 33877 | 64.17 | 2234 | 2202 | 493.6 |
| C | 13 | 61 | 13618 | 23.13 | 2234 | 2202 | 493.6 |
| C | 8 | 128 | 12866 | 21.6 | 2234 | 2202 | 493.6 |
| D | 2 | 120 | 819663 | 1570.4 | 2243 | 2163 | 520.6 |
| D | 10 | 253 | 717123 | 1373.43 | 2243 | 2163 | 520.6 |
| D | 13 | 137 | 683879 | 1309.57 | 2243 | 2163 | 520.6 |
Histogram calculated using DETX and DETY for each event in the final _common_clean file
| Quadrant A |  |
 |
Quadrant B |
|---|---|---|---|
| Quadrant D |  |
 |
Quadrant C |
| Plot type | Count rate plots | Images |
|---|---|---|
| Comparison with Poisson distribution Blue bars denote a histogram of data divided into 1 sec bins. Red curve is a Poisson curve with rate = median count rate of data. |
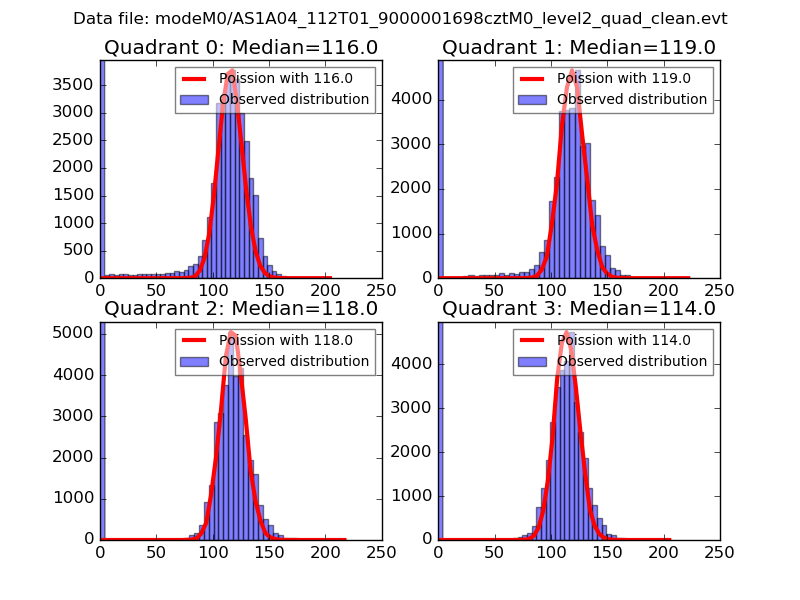 |
 |
| Quadrant-wise count rates Data is divided into 100 sec bins |
 |
|
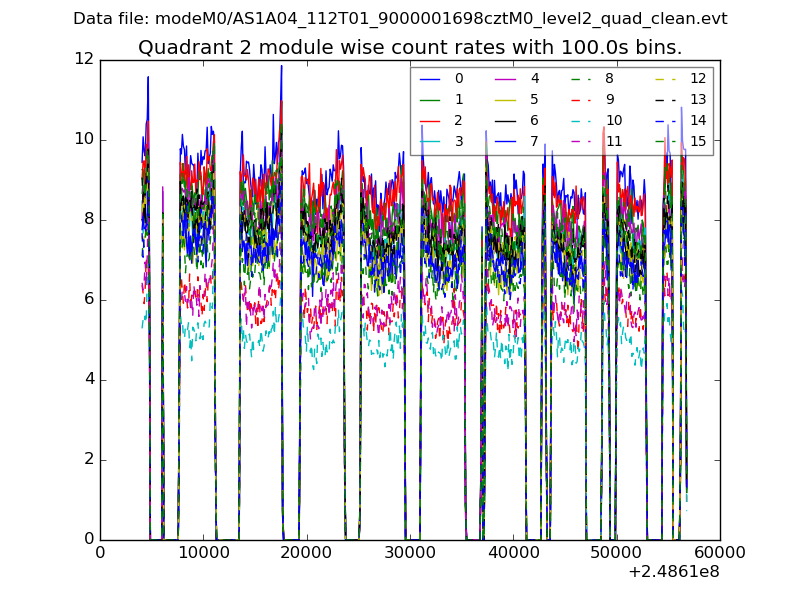
| Module-wise count rates for Quadrant A Data is divided into 100 sec bins |
 |
 |
| Module-wise count rates for Quadrant B Data is divided into 100 sec bins |
 |
 |
| Module-wise count rates for Quadrant C Data is divided into 100 sec bins |
 |
 |
| Module-wise count rates for Quadrant D Data is divided into 100 sec bins |
 |
 |
| Parameter | Plot |
|---|---|
| CZT HV Monitor |  |
| D_VDD |  |
| Temperature 1 |  |
| Veto HV Monitor |  |
| Veto LLD | 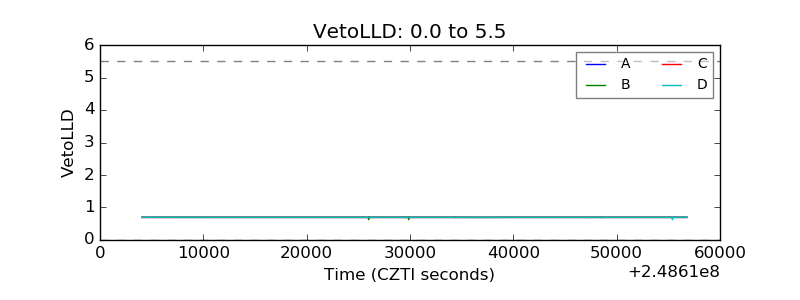 |
| Alpha Counter |  |
| _CPM_Rate | 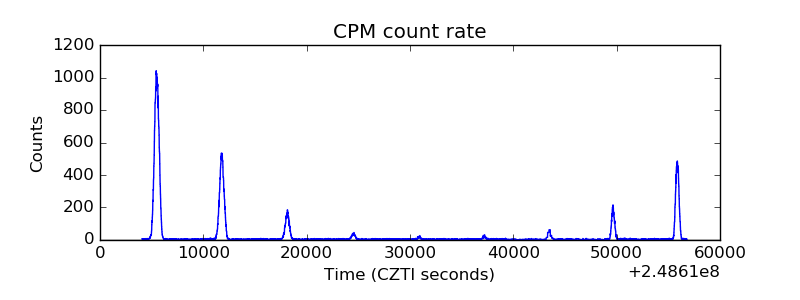 |
| CZT Counter |  |
| +2.5 Volts monitor |  |
| +5 Volts monitor |  |
| _ROLL_ROT |  |
| _Roll_DEC |  |
| _Roll_RA |  |
| Veto Counter |  |