| Param | Original file | Final file |
|---|---|---|
| Filename | modeM0/AS1G08_009T01_9000001696cztM0_level2_bc.evt | modeM0/AS1G08_009T01_9000001696cztM0_level2_quad_clean.evt |
| Size (bytes) | 3,383,242,560 | 877,040,640 |
| Size | 3.2 GB | 836.4 MB |
| Events in quadrant A | 29,183,283 | 5,379,753 |
| Events in quadrant B | 23,981,431 | 5,532,314 |
| Events in quadrant C | 13,738,352 | 5,616,322 |
| Events in quadrant D | 30,744,021 | 5,180,759 |
| Mode SS | |||
|---|---|---|---|
| Quadrant | BADHDUFLAG | Total packets | Discarded packets |
| A | 0 | 1442 | 0 |
| B | 0 | 1442 | 0 |
| C | 0 | 1442 | 0 |
| D | 0 | 1442 | 0 |
| Mode M9 | |||
|---|---|---|---|
| Quadrant | BADHDUFLAG | Total packets | Discarded packets |
| A | 0 | 106 | 0 |
| B | 0 | 106 | 0 |
| C | 0 | 106 | 0 |
| D | 0 | 106 | 0 |
| Mode M0 | |||
|---|---|---|---|
| Quadrant | BADHDUFLAG | Total packets | Discarded packets |
| A | 0 | 212295 | 0 |
| B | 0 | 188011 | 0 |
| C | 0 | 145311 | 0 |
| D | 0 | 206275 | 0 |
| Quadrant | Total seconds | Saturated seconds | Saturation percentage |
|---|---|---|---|
| A | 70757 | 5022 | 7.097531% |
| B | 70757 | 3503 | 4.950747% |
| C | 70757 | 454 | 0.641633% |
| D | 70757 | 4945 | 6.988708% |
Noise dominated data is calculated using 1-second bins in cleaned event files. If a bin has >2000 counts, and if more than 50% of those come from <1% of pixels, then it is considered to be noise-dominated and hence unusable.
| Quadrant | # 1 sec bins | Bins with >0 counts | Bins with >2000 counts | High rate bins dominated by noise | Noise dominated (total time) | Noise dominated (detector-on time) | Marked lightcurve |
|---|---|---|---|---|---|---|---|
| A | 81479 | 70752 | 482 | 482 | 0.59% | 0.68% |  |
| B | 81479 | 70760 | 21 | 21 | 0.03% | 0.03% | 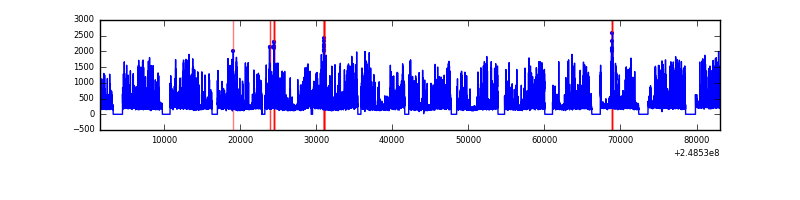 |
| C | 81479 | 70763 | 0 | 0 | 0.00% | 0.00% |  |
| D | 81479 | 70762 | 894 | 894 | 1.10% | 1.26% |  |
Top three noisy pixels from each quadrant. If the there are fewer than three noisy pixels in the level2.evt file, extra rows are filled as -1
| Pixel properties | Quadrant properties | ||||||
|---|---|---|---|---|---|---|---|
| Quadrant | DetID | PixID | Counts | Sigma | Mean | Median | Sigma |
| A | 8 | 5 | 14377678 | 19103.9 | 3469 | 3398 | 752.4 |
| A | 1 | 162 | 589061 | 778.37 | 3469 | 3398 | 752.4 |
| A | 9 | 143 | 232404 | 304.36 | 3469 | 3398 | 752.4 |
| B | 4 | 239 | 6176942 | 9222.03 | 3552 | 3455 | 669.4 |
| B | 15 | 204 | 2348731 | 3503.4 | 3552 | 3455 | 669.4 |
| B | 11 | 51 | 843506 | 1254.88 | 3552 | 3455 | 669.4 |
| C | 9 | 54 | 38062 | 45.38 | 3497 | 3449 | 762.7 |
| C | 13 | 61 | 20922 | 22.91 | 3497 | 3449 | 762.7 |
| C | 12 | 4 | 12985 | 12.5 | 3497 | 3449 | 762.7 |
| D | 1 | 52 | 8377541 | 10592.27 | 3425 | 3300 | 790.6 |
| D | 13 | 137 | 4800260 | 6067.5 | 3425 | 3300 | 790.6 |
| D | 2 | 120 | 1006384 | 1268.76 | 3425 | 3300 | 790.6 |
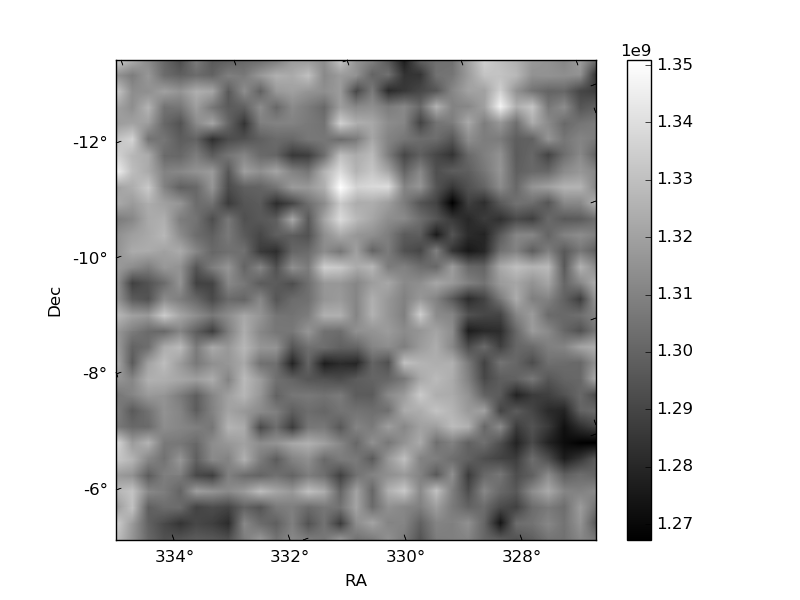
Histogram calculated using DETX and DETY for each event in the final _common_clean file
| Quadrant A |  |
 |
Quadrant B |
|---|---|---|---|
| Quadrant D |  |
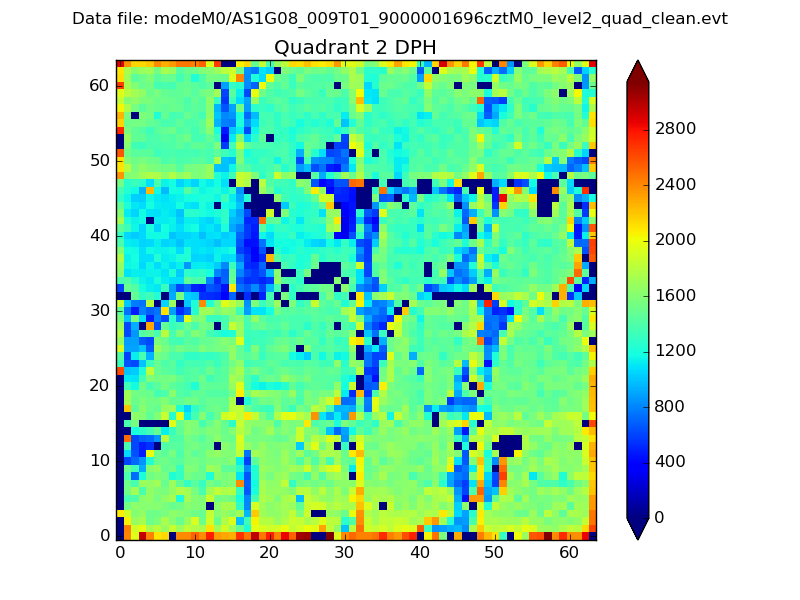 |
Quadrant C |
| Plot type | Count rate plots | Images |
|---|---|---|
| Comparison with Poisson distribution Blue bars denote a histogram of data divided into 1 sec bins. Red curve is a Poisson curve with rate = median count rate of data. |
 |
 |
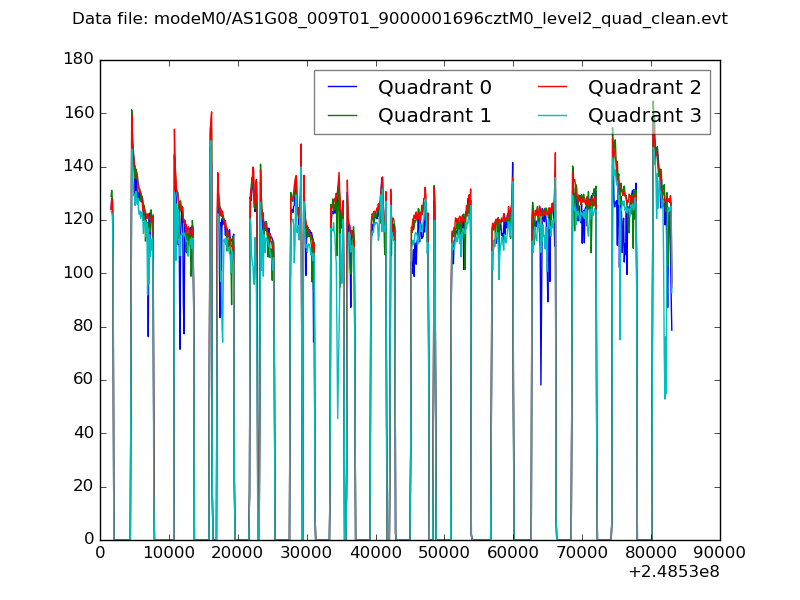
| Quadrant-wise count rates Data is divided into 100 sec bins |
 |
|
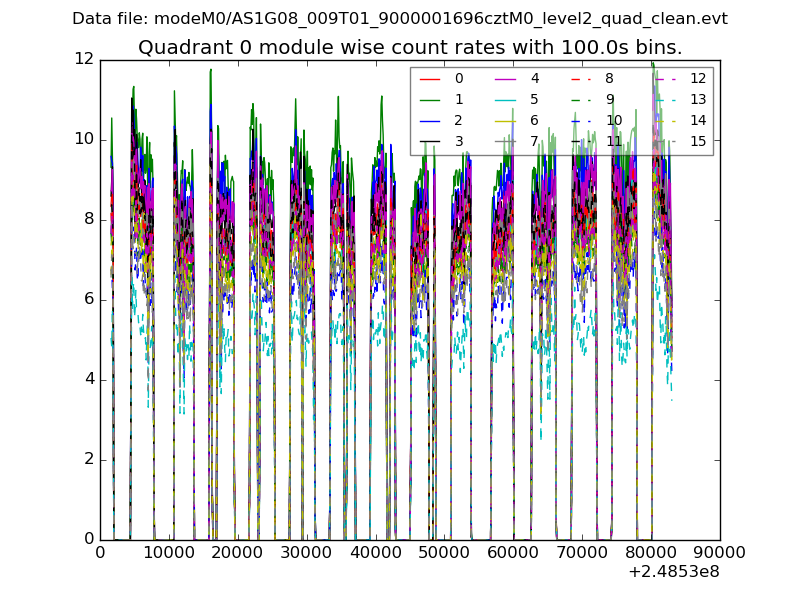
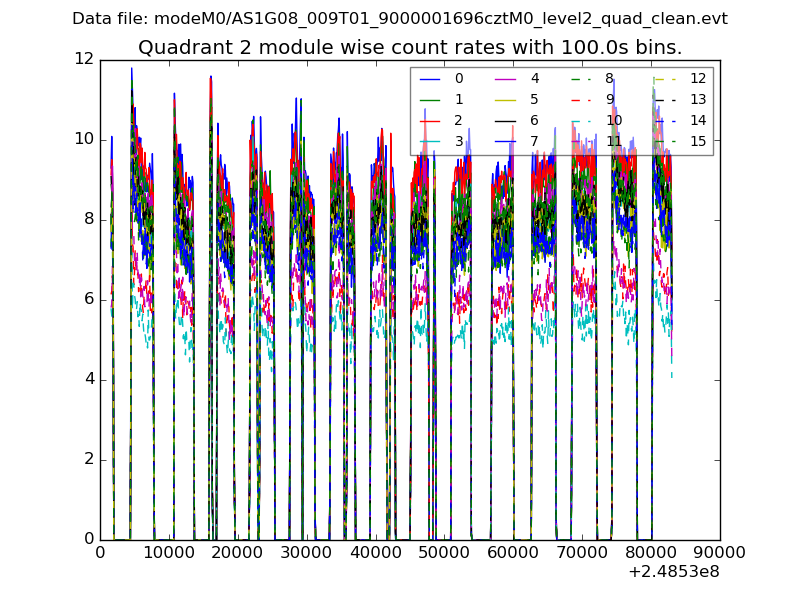
| Module-wise count rates for Quadrant A Data is divided into 100 sec bins |
 |
 |
| Module-wise count rates for Quadrant B Data is divided into 100 sec bins |
 |
 |
| Module-wise count rates for Quadrant C Data is divided into 100 sec bins |
 |
 |
| Module-wise count rates for Quadrant D Data is divided into 100 sec bins |
 |
 |
| Parameter | Plot |
|---|---|
| CZT HV Monitor |  |
| D_VDD |  |
| Temperature 1 |  |
| Veto HV Monitor | 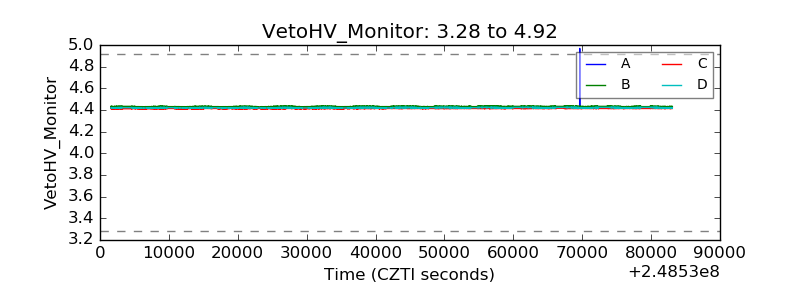 |
| Veto LLD |  |
| Alpha Counter |  |
| _CPM_Rate |  |
| CZT Counter |  |
| +2.5 Volts monitor |  |
| +5 Volts monitor |  |
| _ROLL_ROT |  |
| _Roll_DEC |  |
| _Roll_RA |  |
| Veto Counter |  |