| Param | Original file | Final file |
|---|---|---|
| Filename | modeM0/AS1G08_009T01_9000001692cztM0_level2_bc.evt | modeM0/AS1G08_009T01_9000001692cztM0_level2_quad_clean.evt |
| Size (bytes) | 2,693,828,160 | 739,886,400 |
| Size | 2.5 GB | 705.6 MB |
| Events in quadrant A | 22,781,445 | 4,572,743 |
| Events in quadrant B | 19,631,653 | 4,672,431 |
| Events in quadrant C | 11,441,582 | 4,699,106 |
| Events in quadrant D | 23,684,611 | 4,390,792 |
| Mode M0 | |||
|---|---|---|---|
| Quadrant | BADHDUFLAG | Total packets | Discarded packets |
| A | 0 | 173661 | 0 |
| B | 0 | 155908 | 0 |
| C | 0 | 122143 | 0 |
| D | 0 | 166531 | 0 |
| Mode SS | |||
|---|---|---|---|
| Quadrant | BADHDUFLAG | Total packets | Discarded packets |
| A | 0 | 1212 | 0 |
| B | 0 | 1212 | 0 |
| C | 0 | 1212 | 0 |
| D | 0 | 1212 | 0 |
| Mode M9 | |||
|---|---|---|---|
| Quadrant | BADHDUFLAG | Total packets | Discarded packets |
| A | 0 | 80 | 0 |
| B | 0 | 80 | 0 |
| C | 0 | 80 | 0 |
| D | 0 | 80 | 0 |
| Quadrant | Total seconds | Saturated seconds | Saturation percentage |
|---|---|---|---|
| A | 59368 | 3775 | 6.358644% |
| B | 59368 | 2933 | 4.940372% |
| C | 59368 | 358 | 0.603018% |
| D | 59368 | 3864 | 6.508557% |
Noise dominated data is calculated using 1-second bins in cleaned event files. If a bin has >2000 counts, and if more than 50% of those come from <1% of pixels, then it is considered to be noise-dominated and hence unusable.
| Quadrant | # 1 sec bins | Bins with >0 counts | Bins with >2000 counts | High rate bins dominated by noise | Noise dominated (total time) | Noise dominated (detector-on time) | Marked lightcurve |
|---|---|---|---|---|---|---|---|
| A | 122669 | 59366 | 106 | 106 | 0.09% | 0.18% |  |
| B | 122669 | 59370 | 11 | 11 | 0.01% | 0.02% |  |
| C | 122669 | 59374 | 0 | 0 | 0.00% | 0.00% |  |
| D | 122669 | 59372 | 660 | 660 | 0.54% | 1.11% |  |
Top three noisy pixels from each quadrant. If the there are fewer than three noisy pixels in the level2.evt file, extra rows are filled as -1
| Pixel properties | Quadrant properties | ||||||
|---|---|---|---|---|---|---|---|
| Quadrant | DetID | PixID | Counts | Sigma | Mean | Median | Sigma |
| A | 8 | 5 | 10235261 | 16136.12 | 2928 | 2869 | 634.1 |
| A | 1 | 162 | 538759 | 845.08 | 2928 | 2869 | 634.1 |
| A | 9 | 143 | 381763 | 597.5 | 2928 | 2869 | 634.1 |
| B | 4 | 239 | 5595849 | 9903.58 | 2977 | 2897 | 564.7 |
| B | 15 | 204 | 1391396 | 2458.65 | 2977 | 2897 | 564.7 |
| B | 11 | 51 | 421510 | 741.25 | 2977 | 2897 | 564.7 |
| C | 13 | 61 | 17799 | 23.44 | 2920 | 2875 | 636.7 |
| C | 7 | 247 | 9248 | 10.01 | 2920 | 2875 | 636.7 |
| C | 12 | 4 | 8629 | 9.04 | 2920 | 2875 | 636.7 |
| D | 1 | 52 | 6301035 | 9394.33 | 2878 | 2771 | 670.4 |
| D | 13 | 137 | 2994967 | 4463.08 | 2878 | 2771 | 670.4 |
| D | 1 | 255 | 758153 | 1126.71 | 2878 | 2771 | 670.4 |
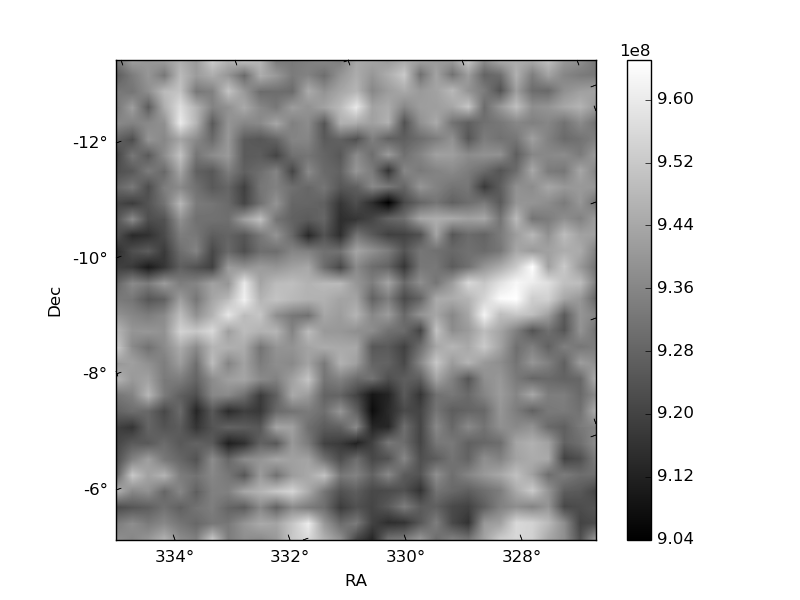
Histogram calculated using DETX and DETY for each event in the final _common_clean file
| Quadrant A |  |
 |
Quadrant B |
|---|---|---|---|
| Quadrant D |  |
 |
Quadrant C |
| Plot type | Count rate plots | Images |
|---|---|---|
| Comparison with Poisson distribution Blue bars denote a histogram of data divided into 1 sec bins. Red curve is a Poisson curve with rate = median count rate of data. |
 |
 |
| Quadrant-wise count rates Data is divided into 100 sec bins |
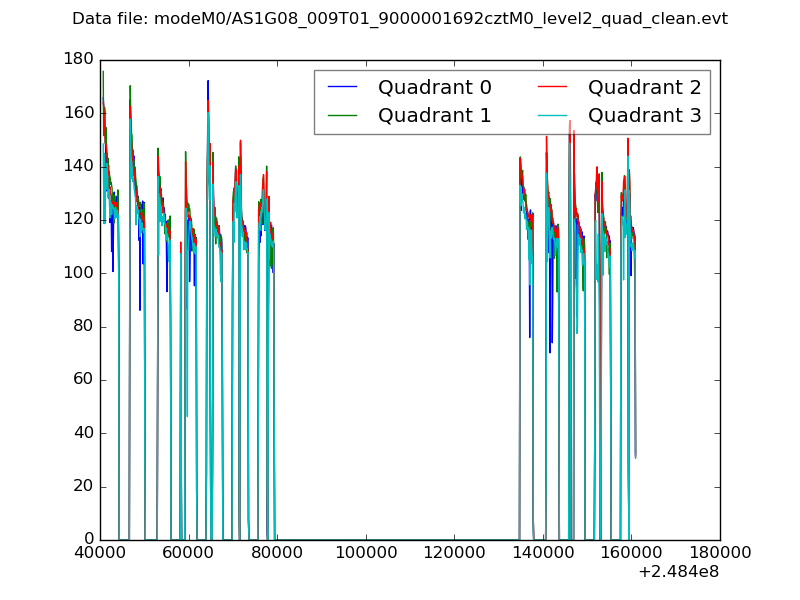 |
|
| Module-wise count rates for Quadrant A Data is divided into 100 sec bins |
 |
 |
| Module-wise count rates for Quadrant B Data is divided into 100 sec bins |
 |
 |
| Module-wise count rates for Quadrant C Data is divided into 100 sec bins |
 |
 |
| Module-wise count rates for Quadrant D Data is divided into 100 sec bins |
 |
 |
| Parameter | Plot |
|---|---|
| CZT HV Monitor |  |
| D_VDD |  |
| Temperature 1 |  |
| Veto HV Monitor |  |
| Veto LLD |  |
| Alpha Counter |  |
| _CPM_Rate |  |
| CZT Counter | 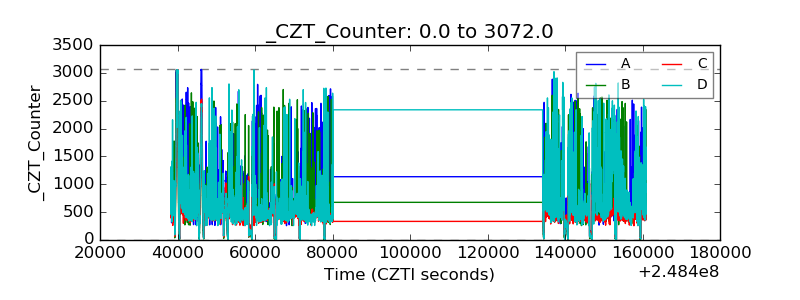 |
| +2.5 Volts monitor | 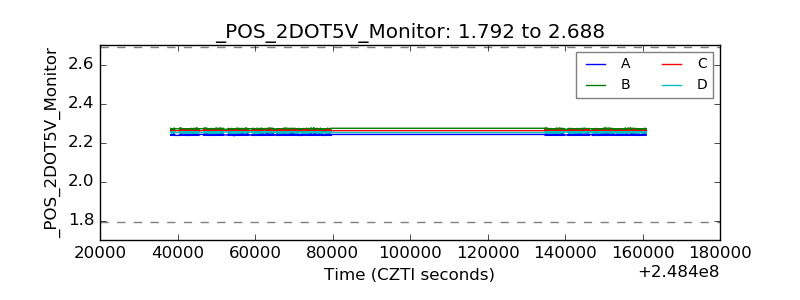 |
| +5 Volts monitor |  |
| _ROLL_ROT |  |
| _Roll_DEC |  |
| _Roll_RA |  |
| Veto Counter |  |