| Param | Original file | Final file |
|---|---|---|
| Filename | modeM0/AS1A04_022T05_9000001690cztM0_level2_bc.evt | modeM0/AS1A04_022T05_9000001690cztM0_level2_quad_clean.evt |
| Size (bytes) | 2,992,711,680 | 842,500,800 |
| Size | 2.8 GB | 803.5 MB |
| Events in quadrant A | 27,850,390 | 5,046,926 |
| Events in quadrant B | 20,823,635 | 5,214,523 |
| Events in quadrant C | 13,096,055 | 5,556,032 |
| Events in quadrant D | 24,355,441 | 5,156,453 |
| Mode SS | |||
|---|---|---|---|
| Quadrant | BADHDUFLAG | Total packets | Discarded packets |
| A | 0 | 1348 | 0 |
| B | 0 | 1348 | 0 |
| C | 0 | 1348 | 0 |
| D | 0 | 1348 | 0 |
| Mode M0 | |||
|---|---|---|---|
| Quadrant | BADHDUFLAG | Total packets | Discarded packets |
| A | 0 | 204800 | 0 |
| B | 0 | 167240 | 0 |
| C | 0 | 135415 | 0 |
| D | 0 | 173435 | 0 |
| Mode M9 | |||
|---|---|---|---|
| Quadrant | BADHDUFLAG | Total packets | Discarded packets |
| A | 0 | 95 | 0 |
| B | 0 | 95 | 0 |
| C | 0 | 95 | 0 |
| D | 0 | 95 | 0 |
| Quadrant | Total seconds | Saturated seconds | Saturation percentage |
|---|---|---|---|
| A | 66241 | 6203 | 9.364291% |
| B | 66241 | 2728 | 4.118295% |
| C | 66241 | 361 | 0.544980% |
| D | 66241 | 1813 | 2.736976% |
Noise dominated data is calculated using 1-second bins in cleaned event files. If a bin has >2000 counts, and if more than 50% of those come from <1% of pixels, then it is considered to be noise-dominated and hence unusable.
| Quadrant | # 1 sec bins | Bins with >0 counts | Bins with >2000 counts | High rate bins dominated by noise | Noise dominated (total time) | Noise dominated (detector-on time) | Marked lightcurve |
|---|---|---|---|---|---|---|---|
| A | 75757 | 66235 | 264 | 264 | 0.35% | 0.40% | 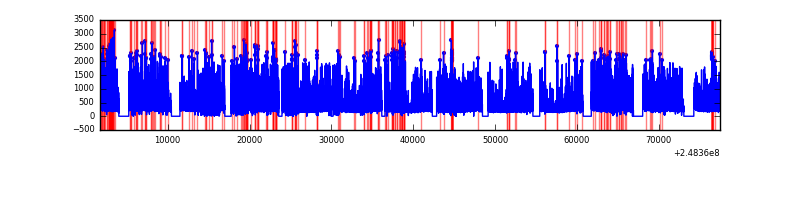 |
| B | 75757 | 66242 | 15 | 15 | 0.02% | 0.02% | 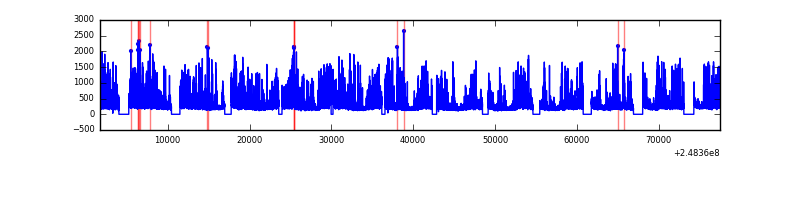 |
| C | 75757 | 66242 | 0 | 0 | 0.00% | 0.00% |  |
| D | 75757 | 66244 | 224 | 224 | 0.30% | 0.34% |  |
Top three noisy pixels from each quadrant. If the there are fewer than three noisy pixels in the level2.evt file, extra rows are filled as -1
| Pixel properties | Quadrant properties | ||||||
|---|---|---|---|---|---|---|---|
| Quadrant | DetID | PixID | Counts | Sigma | Mean | Median | Sigma |
| A | 8 | 5 | 14503543 | 21148.46 | 3167 | 3103 | 685.6 |
| A | 9 | 143 | 541881 | 785.79 | 3167 | 3103 | 685.6 |
| A | 1 | 162 | 283270 | 408.61 | 3167 | 3103 | 685.6 |
| B | 4 | 239 | 5606282 | 9029.04 | 3278 | 3190 | 620.6 |
| B | 15 | 204 | 869741 | 1396.39 | 3278 | 3190 | 620.6 |
| B | 11 | 51 | 405932 | 648.99 | 3278 | 3190 | 620.6 |
| C | 13 | 61 | 19426 | 20.7 | 3338 | 3263 | 780.9 |
| C | 14 | 67 | 18470 | 19.47 | 3338 | 3263 | 780.9 |
| C | 7 | 236 | 14409 | 14.27 | 3338 | 3263 | 780.9 |
| D | 1 | 52 | 3081083 | 3942.22 | 3306 | 3179 | 780.8 |
| D | 5 | 222 | 2038354 | 2606.68 | 3306 | 3179 | 780.8 |
| D | 13 | 152 | 1676713 | 2143.48 | 3306 | 3179 | 780.8 |
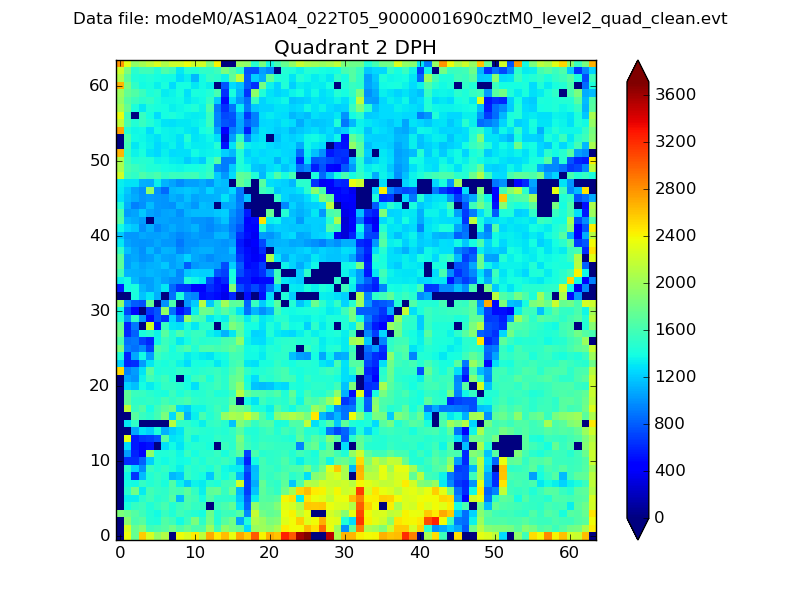
Histogram calculated using DETX and DETY for each event in the final _common_clean file
| Quadrant A | 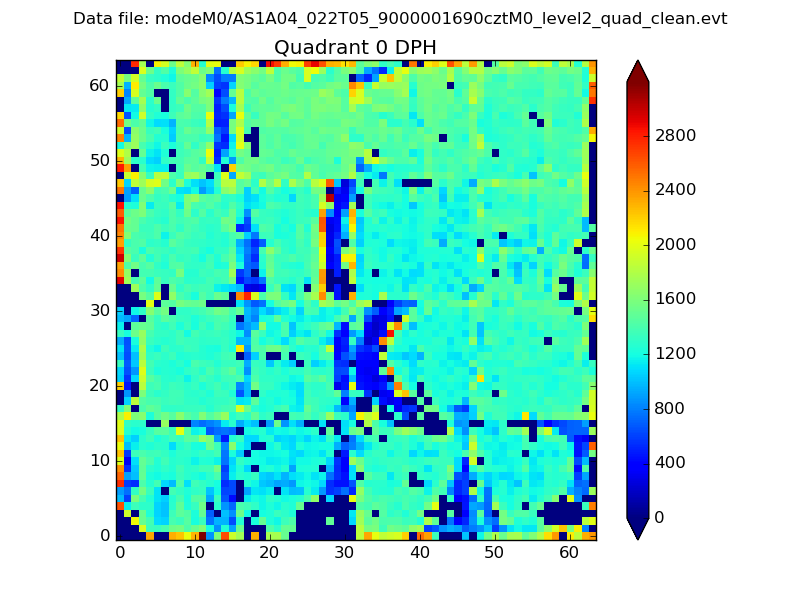 |
 |
Quadrant B |
|---|---|---|---|
| Quadrant D |  |
 |
Quadrant C |
| Plot type | Count rate plots | Images |
|---|---|---|
| Comparison with Poisson distribution Blue bars denote a histogram of data divided into 1 sec bins. Red curve is a Poisson curve with rate = median count rate of data. |
 |
 |
| Quadrant-wise count rates Data is divided into 100 sec bins |
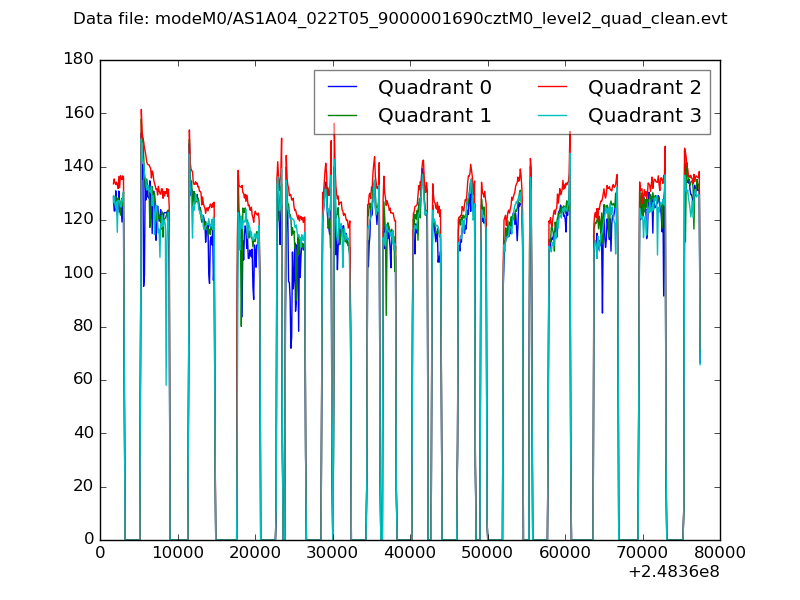 |
|
| Module-wise count rates for Quadrant A Data is divided into 100 sec bins |
 |
 |
| Module-wise count rates for Quadrant B Data is divided into 100 sec bins |
 |
 |
| Module-wise count rates for Quadrant C Data is divided into 100 sec bins |
 |
 |
| Module-wise count rates for Quadrant D Data is divided into 100 sec bins |
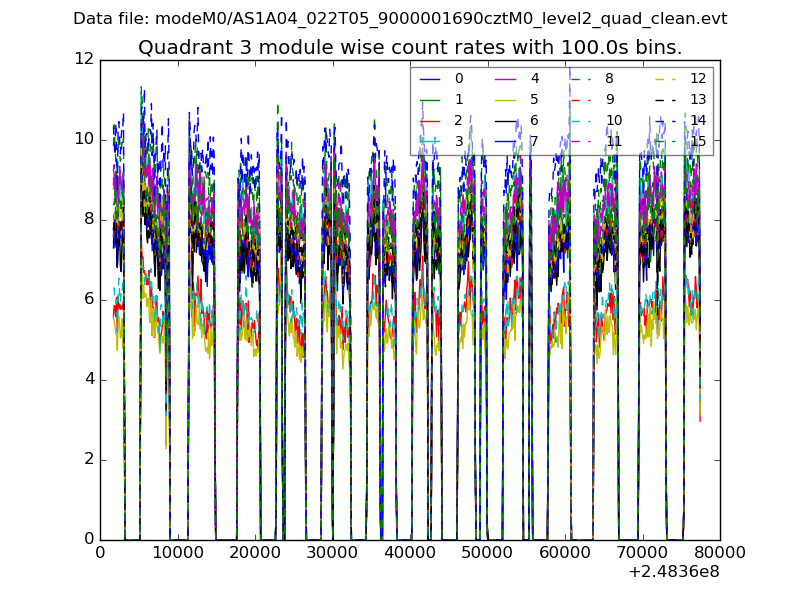 |
 |
| Parameter | Plot |
|---|---|
| CZT HV Monitor | 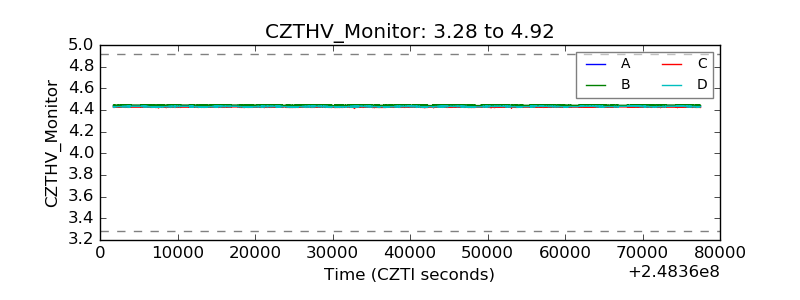 |
| D_VDD |  |
| Temperature 1 | 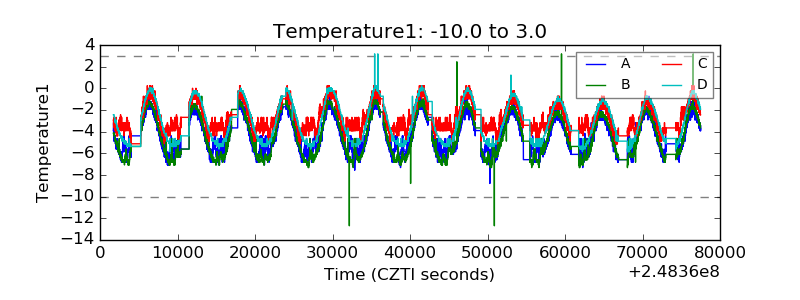 |
| Veto HV Monitor |  |
| Veto LLD |  |
| Alpha Counter |  |
| _CPM_Rate |  |
| CZT Counter |  |
| +2.5 Volts monitor | 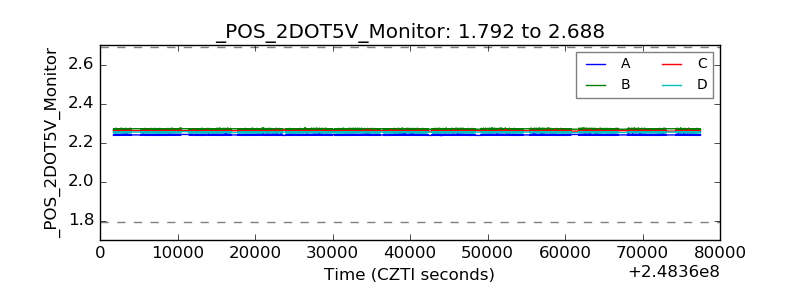 |
| +5 Volts monitor |  |
| _ROLL_ROT | 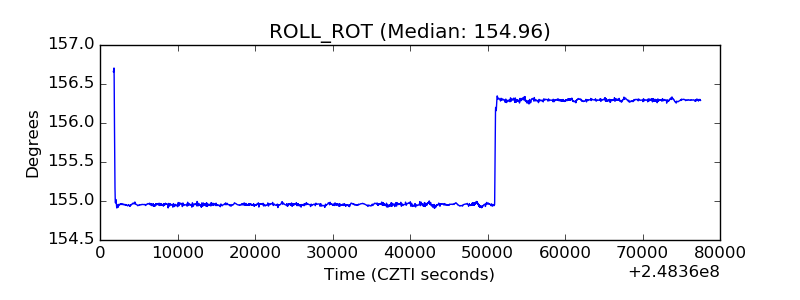 |
| _Roll_DEC |  |
| _Roll_RA |  |
| Veto Counter |  |