| Param | Original file | Final file |
|---|---|---|
| Filename | modeM0/AS1A04_021T06_9000001688cztM0_level2_bc.evt | modeM0/AS1A04_021T06_9000001688cztM0_level2_quad_clean.evt |
| Size (bytes) | 3,144,191,040 | 838,460,160 |
| Size | 2.9 GB | 799.6 MB |
| Events in quadrant A | 33,630,144 | 4,785,830 |
| Events in quadrant B | 22,546,440 | 5,223,939 |
| Events in quadrant C | 13,318,572 | 5,620,363 |
| Events in quadrant D | 21,238,201 | 5,242,762 |
| Mode M9 | |||
|---|---|---|---|
| Quadrant | BADHDUFLAG | Total packets | Discarded packets |
| A | 0 | 95 | 0 |
| B | 0 | 95 | 0 |
| C | 0 | 95 | 0 |
| D | 0 | 95 | 0 |
| Mode SS | |||
|---|---|---|---|
| Quadrant | BADHDUFLAG | Total packets | Discarded packets |
| A | 0 | 1342 | 0 |
| B | 0 | 1342 | 0 |
| C | 0 | 1342 | 0 |
| D | 0 | 1342 | 0 |
| Mode M0 | |||
|---|---|---|---|
| Quadrant | BADHDUFLAG | Total packets | Discarded packets |
| A | 0 | 240758 | 0 |
| B | 0 | 175244 | 0 |
| C | 0 | 135550 | 0 |
| D | 0 | 162722 | 0 |
| Quadrant | Total seconds | Saturated seconds | Saturation percentage |
|---|---|---|---|
| A | 65902 | 11994 | 18.199751% |
| B | 65902 | 3496 | 5.304847% |
| C | 65902 | 446 | 0.676762% |
| D | 65902 | 1617 | 2.453643% |
Noise dominated data is calculated using 1-second bins in cleaned event files. If a bin has >2000 counts, and if more than 50% of those come from <1% of pixels, then it is considered to be noise-dominated and hence unusable.
| Quadrant | # 1 sec bins | Bins with >0 counts | Bins with >2000 counts | High rate bins dominated by noise | Noise dominated (total time) | Noise dominated (detector-on time) | Marked lightcurve |
|---|---|---|---|---|---|---|---|
| A | 75353 | 65874 | 654 | 654 | 0.87% | 0.99% |  |
| B | 75353 | 65903 | 96 | 96 | 0.13% | 0.15% | 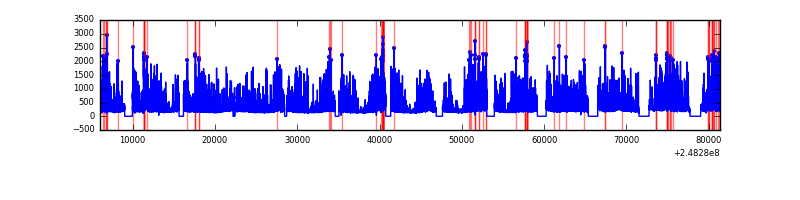 |
| C | 75353 | 65905 | 1 | 1 | 0.00% | 0.00% |  |
| D | 75353 | 65907 | 210 | 210 | 0.28% | 0.32% |  |
Top three noisy pixels from each quadrant. If the there are fewer than three noisy pixels in the level2.evt file, extra rows are filled as -1
| Pixel properties | Quadrant properties | ||||||
|---|---|---|---|---|---|---|---|
| Quadrant | DetID | PixID | Counts | Sigma | Mean | Median | Sigma |
| A | 8 | 5 | 19210884 | 29403.02 | 3010 | 2955 | 653.3 |
| A | 14 | 238 | 1208897 | 1846.03 | 3010 | 2955 | 653.3 |
| A | 15 | 223 | 535041 | 814.5 | 3010 | 2955 | 653.3 |
| B | 4 | 239 | 4929817 | 7906.54 | 3279 | 3185 | 623.1 |
| B | 3 | 64 | 2533887 | 4061.42 | 3279 | 3185 | 623.1 |
| B | 11 | 51 | 763255 | 1219.8 | 3279 | 3185 | 623.1 |
| C | 7 | 87 | 126589 | 158.69 | 3349 | 3281 | 777.0 |
| C | 0 | 207 | 48775 | 58.55 | 3349 | 3281 | 777.0 |
| C | 12 | 4 | 29873 | 34.22 | 3349 | 3281 | 777.0 |
| D | 1 | 52 | 2988376 | 3858.34 | 3324 | 3200 | 773.7 |
| D | 2 | 120 | 1064518 | 1371.75 | 3324 | 3200 | 773.7 |
| D | 8 | 195 | 766642 | 986.75 | 3324 | 3200 | 773.7 |
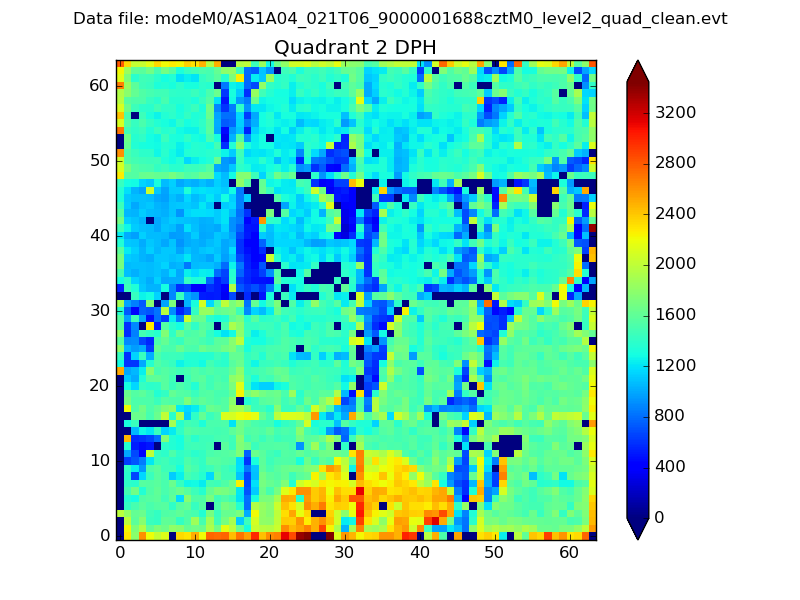
Histogram calculated using DETX and DETY for each event in the final _common_clean file
| Quadrant A |  |
 |
Quadrant B |
|---|---|---|---|
| Quadrant D | 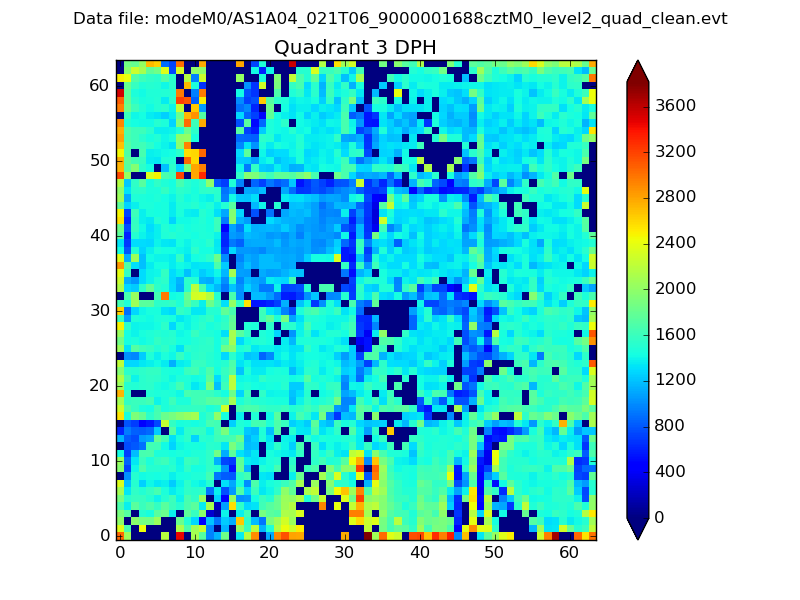 |
 |
Quadrant C |
| Plot type | Count rate plots | Images |
|---|---|---|
| Comparison with Poisson distribution Blue bars denote a histogram of data divided into 1 sec bins. Red curve is a Poisson curve with rate = median count rate of data. |
 |
 |
| Quadrant-wise count rates Data is divided into 100 sec bins |
 |
|
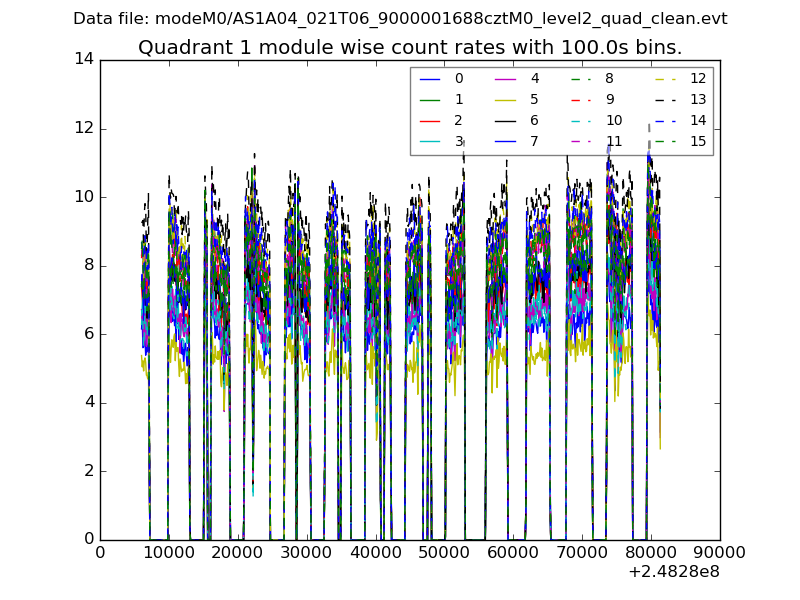
| Module-wise count rates for Quadrant A Data is divided into 100 sec bins |
 |
 |
| Module-wise count rates for Quadrant B Data is divided into 100 sec bins |
 |
 |
| Module-wise count rates for Quadrant C Data is divided into 100 sec bins |
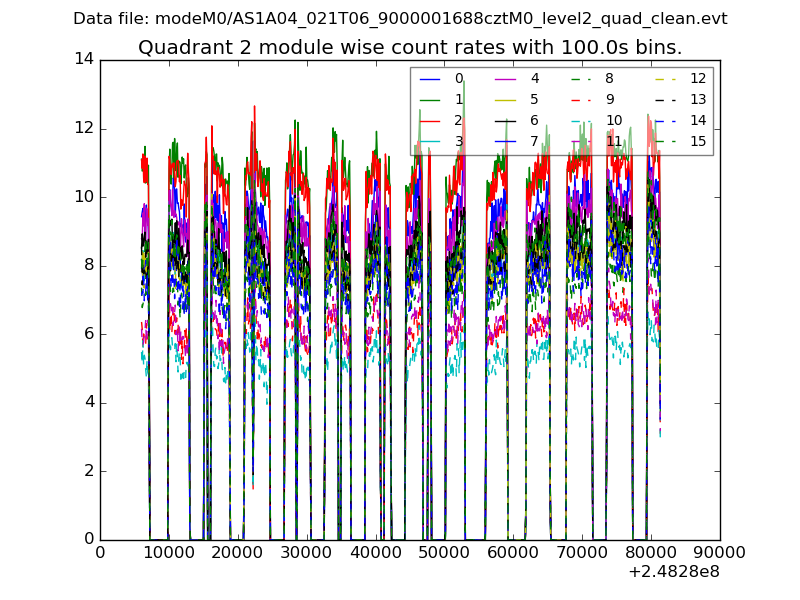 |
 |
| Module-wise count rates for Quadrant D Data is divided into 100 sec bins |
 |
 |
| Parameter | Plot |
|---|---|
| CZT HV Monitor |  |
| D_VDD |  |
| Temperature 1 | 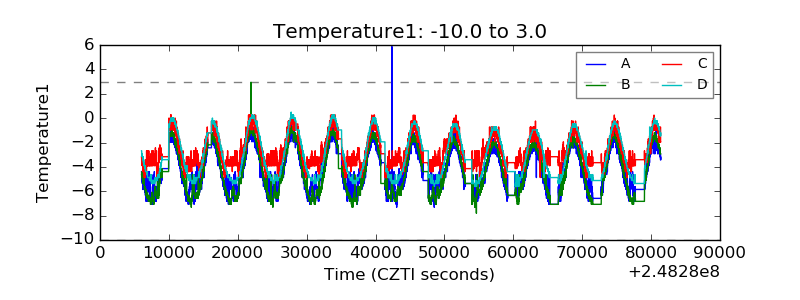 |
| Veto HV Monitor |  |
| Veto LLD |  |
| Alpha Counter | 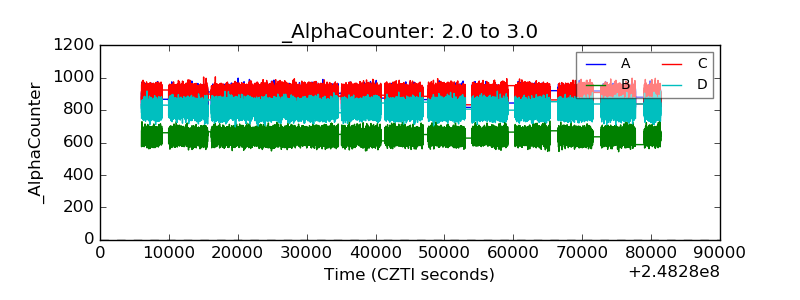 |
| _CPM_Rate |  |
| CZT Counter |  |
| +2.5 Volts monitor |  |
| +5 Volts monitor | 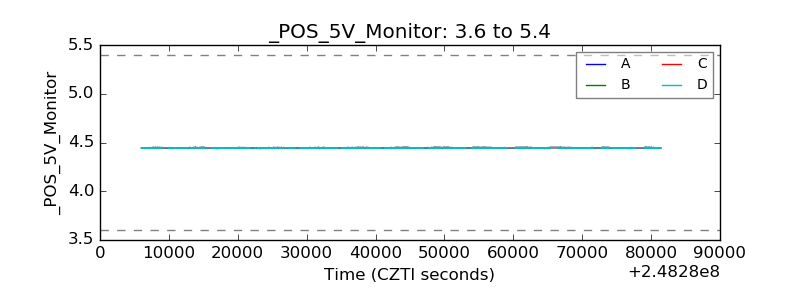 |
| _ROLL_ROT |  |
| _Roll_DEC | 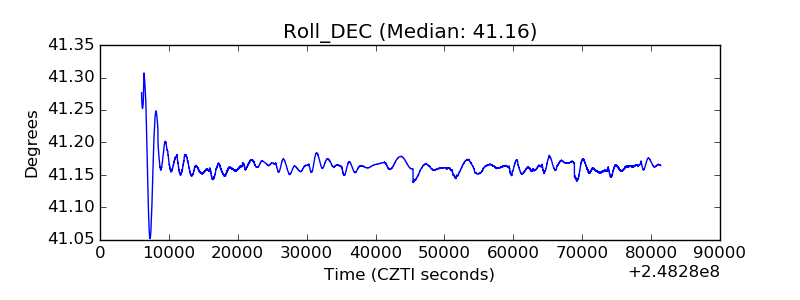 |
| _Roll_RA |  |
| Veto Counter |  |