| Param | Original file | Final file |
|---|---|---|
| Filename | modeM0/AS1A04_021T05_9000001686cztM0_level2_bc.evt | modeM0/AS1A04_021T05_9000001686cztM0_level2_quad_clean.evt |
| Size (bytes) | 3,716,737,920 | 853,954,560 |
| Size | 3.5 GB | 814.4 MB |
| Events in quadrant A | 37,694,568 | 5,024,376 |
| Events in quadrant B | 33,012,895 | 5,265,836 |
| Events in quadrant C | 13,125,252 | 5,786,010 |
| Events in quadrant D | 24,295,057 | 5,313,724 |
| Mode M9 | |||
|---|---|---|---|
| Quadrant | BADHDUFLAG | Total packets | Discarded packets |
| A | 0 | 100 | 0 |
| B | 0 | 100 | 0 |
| C | 0 | 100 | 0 |
| D | 0 | 100 | 0 |
| Mode SS | |||
|---|---|---|---|
| Quadrant | BADHDUFLAG | Total packets | Discarded packets |
| A | 0 | 1330 | 0 |
| B | 0 | 1330 | 0 |
| C | 0 | 1330 | 0 |
| D | 0 | 1330 | 0 |
| Mode M0 | |||
|---|---|---|---|
| Quadrant | BADHDUFLAG | Total packets | Discarded packets |
| A | 0 | 243867 | 0 |
| B | 0 | 213563 | 0 |
| C | 0 | 133705 | 0 |
| D | 0 | 172142 | 0 |
| Quadrant | Total seconds | Saturated seconds | Saturation percentage |
|---|---|---|---|
| A | 65186 | 10612 | 16.279569% |
| B | 65186 | 8675 | 13.308072% |
| C | 65186 | 465 | 0.713343% |
| D | 65186 | 3018 | 4.629828% |
Noise dominated data is calculated using 1-second bins in cleaned event files. If a bin has >2000 counts, and if more than 50% of those come from <1% of pixels, then it is considered to be noise-dominated and hence unusable.
| Quadrant | # 1 sec bins | Bins with >0 counts | Bins with >2000 counts | High rate bins dominated by noise | Noise dominated (total time) | Noise dominated (detector-on time) | Marked lightcurve |
|---|---|---|---|---|---|---|---|
| A | 75227 | 65183 | 913 | 913 | 1.21% | 1.40% |  |
| B | 75227 | 65185 | 1014 | 1014 | 1.35% | 1.56% |  |
| C | 75227 | 65190 | 1 | 1 | 0.00% | 0.00% |  |
| D | 75227 | 65189 | 866 | 866 | 1.15% | 1.33% |  |
Top three noisy pixels from each quadrant. If the there are fewer than three noisy pixels in the level2.evt file, extra rows are filled as -1
| Pixel properties | Quadrant properties | ||||||
|---|---|---|---|---|---|---|---|
| Quadrant | DetID | PixID | Counts | Sigma | Mean | Median | Sigma |
| A | 8 | 5 | 24497641 | 36605.2 | 3088 | 3032 | 669.2 |
| A | 15 | 223 | 334522 | 495.38 | 3088 | 3032 | 669.2 |
| A | 9 | 143 | 209603 | 308.7 | 3088 | 3032 | 669.2 |
| B | 4 | 81 | 11522403 | 19333.7 | 3147 | 3063 | 595.8 |
| B | 4 | 239 | 5181116 | 8690.68 | 3147 | 3063 | 595.8 |
| B | 3 | 64 | 2173654 | 3643.05 | 3147 | 3063 | 595.8 |
| C | 12 | 4 | 57326 | 69.63 | 3342 | 3276 | 776.3 |
| C | 13 | 61 | 19837 | 21.33 | 3342 | 3276 | 776.3 |
| C | 14 | 234 | 13170 | 12.75 | 3342 | 3276 | 776.3 |
| D | 1 | 52 | 5501786 | 7182.7 | 3275 | 3152 | 765.5 |
| D | 6 | 219 | 1582685 | 2063.3 | 3275 | 3152 | 765.5 |
| D | 8 | 195 | 1260346 | 1642.23 | 3275 | 3152 | 765.5 |
Histogram calculated using DETX and DETY for each event in the final _common_clean file
| Quadrant A |  |
 |
Quadrant B |
|---|---|---|---|
| Quadrant D | 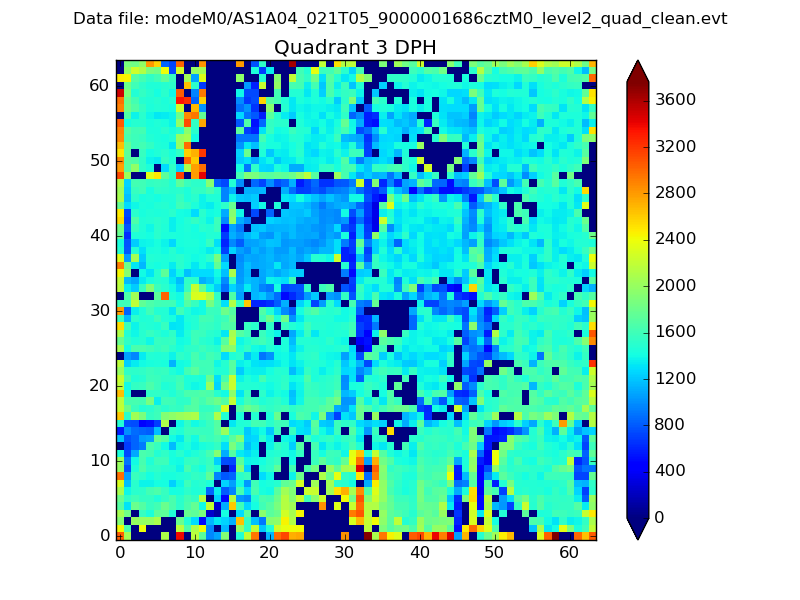 |
 |
Quadrant C |
| Plot type | Count rate plots | Images |
|---|---|---|
| Comparison with Poisson distribution Blue bars denote a histogram of data divided into 1 sec bins. Red curve is a Poisson curve with rate = median count rate of data. |
 |
 |
| Quadrant-wise count rates Data is divided into 100 sec bins |
 |
|
| Module-wise count rates for Quadrant A Data is divided into 100 sec bins |
 |
 |
| Module-wise count rates for Quadrant B Data is divided into 100 sec bins |
 |
 |
| Module-wise count rates for Quadrant C Data is divided into 100 sec bins |
 |
 |
| Module-wise count rates for Quadrant D Data is divided into 100 sec bins |
 |
 |
| Parameter | Plot |
|---|---|
| CZT HV Monitor |  |
| D_VDD |  |
| Temperature 1 |  |
| Veto HV Monitor |  |
| Veto LLD |  |
| Alpha Counter | 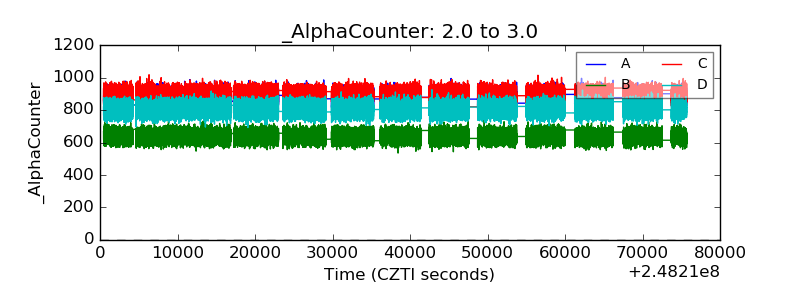 |
| _CPM_Rate |  |
| CZT Counter |  |
| +2.5 Volts monitor | 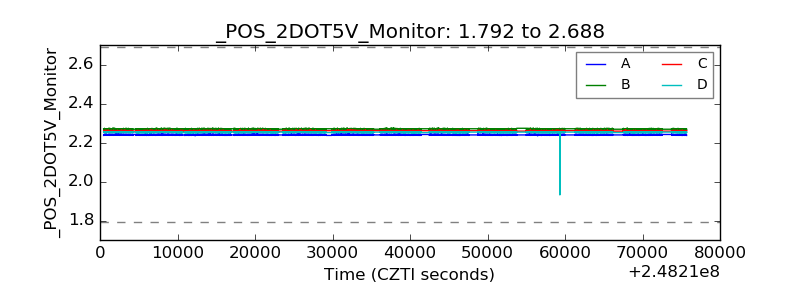 |
| +5 Volts monitor |  |
| _ROLL_ROT | 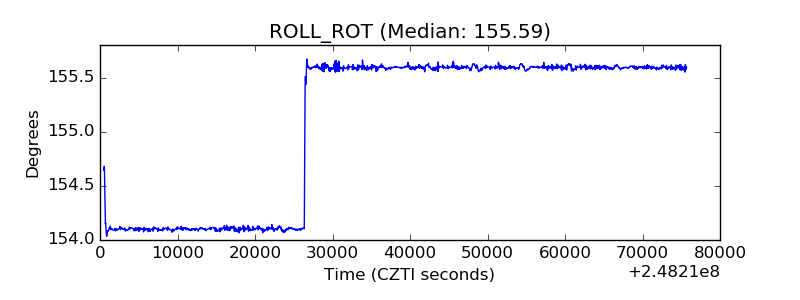 |
| _Roll_DEC | 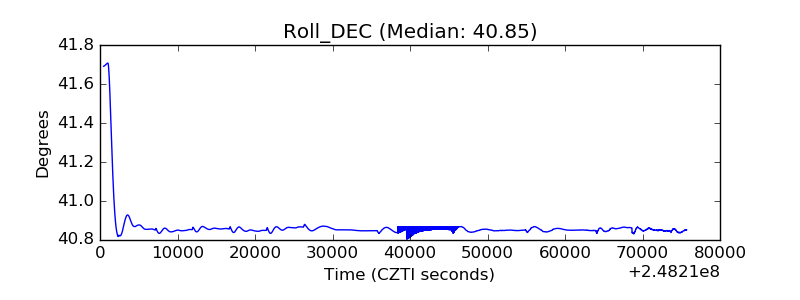 |
| _Roll_RA |  |
| Veto Counter |  |