| Param | Original file | Final file |
|---|---|---|
| Filename | modeM0/AS1A04_107T01_9000001684cztM0_level2_bc.evt | modeM0/AS1A04_107T01_9000001684cztM0_level2_quad_clean.evt |
| Size (bytes) | 4,038,586,560 | 977,160,960 |
| Size | 3.8 GB | 931.9 MB |
| Events in quadrant A | 47,919,168 | 5,799,908 |
| Events in quadrant B | 29,676,427 | 6,175,223 |
| Events in quadrant C | 14,766,977 | 6,387,017 |
| Events in quadrant D | 24,851,712 | 6,094,924 |
| Mode M9 | |||
|---|---|---|---|
| Quadrant | BADHDUFLAG | Total packets | Discarded packets |
| A | 0 | 116 | 0 |
| B | 0 | 116 | 0 |
| C | 0 | 116 | 0 |
| D | 0 | 116 | 0 |
| Mode SS | |||
|---|---|---|---|
| Quadrant | BADHDUFLAG | Total packets | Discarded packets |
| A | 0 | 1528 | 0 |
| B | 0 | 1528 | 0 |
| C | 0 | 1528 | 0 |
| D | 0 | 1528 | 0 |
| Mode M0 | |||
|---|---|---|---|
| Quadrant | BADHDUFLAG | Total packets | Discarded packets |
| A | 0 | 292799 | 0 |
| B | 0 | 217701 | 0 |
| C | 0 | 153348 | 0 |
| D | 0 | 183042 | 0 |
| Quadrant | Total seconds | Saturated seconds | Saturation percentage |
|---|---|---|---|
| A | 74886 | 13831 | 18.469407% |
| B | 74886 | 6589 | 8.798707% |
| C | 74886 | 414 | 0.552840% |
| D | 74886 | 1796 | 2.398312% |
Noise dominated data is calculated using 1-second bins in cleaned event files. If a bin has >2000 counts, and if more than 50% of those come from <1% of pixels, then it is considered to be noise-dominated and hence unusable.
| Quadrant | # 1 sec bins | Bins with >0 counts | Bins with >2000 counts | High rate bins dominated by noise | Noise dominated (total time) | Noise dominated (detector-on time) | Marked lightcurve |
|---|---|---|---|---|---|---|---|
| A | 86547 | 74878 | 1475 | 1475 | 1.70% | 1.97% |  |
| B | 86547 | 74887 | 199 | 199 | 0.23% | 0.27% |  |
| C | 86547 | 74886 | 1 | 1 | 0.00% | 0.00% |  |
| D | 86547 | 74885 | 299 | 299 | 0.35% | 0.40% | 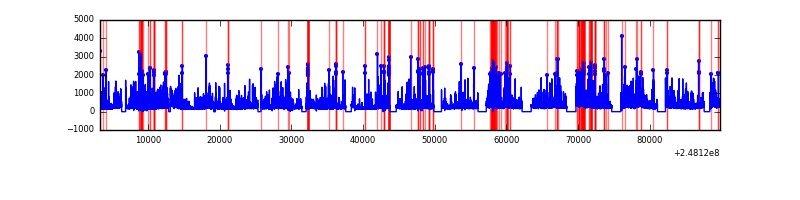 |
Top three noisy pixels from each quadrant. If the there are fewer than three noisy pixels in the level2.evt file, extra rows are filled as -1
| Pixel properties | Quadrant properties | ||||||
|---|---|---|---|---|---|---|---|
| Quadrant | DetID | PixID | Counts | Sigma | Mean | Median | Sigma |
| A | 8 | 5 | 33145144 | 43142.62 | 3519 | 3460 | 768.2 |
| A | 9 | 143 | 285279 | 366.86 | 3519 | 3460 | 768.2 |
| A | 15 | 223 | 248269 | 318.68 | 3519 | 3460 | 768.2 |
| B | 4 | 239 | 6723128 | 9621.18 | 3673 | 3582 | 698.4 |
| B | 4 | 81 | 3743551 | 5354.96 | 3673 | 3582 | 698.4 |
| B | 3 | 64 | 2432804 | 3478.21 | 3673 | 3582 | 698.4 |
| C | 3 | 9 | 85204 | 97.63 | 3732 | 3672 | 835.1 |
| C | 12 | 4 | 48622 | 53.83 | 3732 | 3672 | 835.1 |
| C | 14 | 234 | 23917 | 24.24 | 3732 | 3672 | 835.1 |
| D | 1 | 52 | 5061704 | 5692.4 | 3770 | 3651 | 888.6 |
| D | 2 | 120 | 1109394 | 1244.42 | 3770 | 3651 | 888.6 |
| D | 13 | 152 | 886352 | 993.4 | 3770 | 3651 | 888.6 |
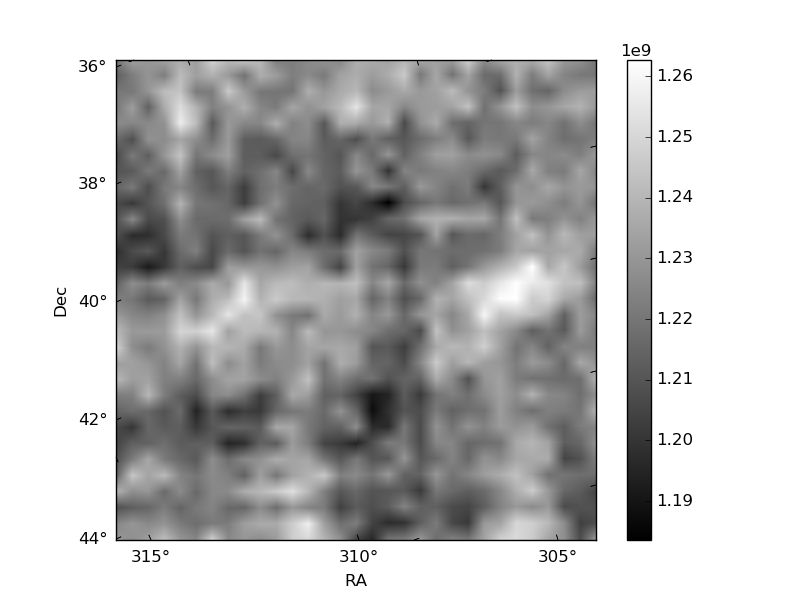
Histogram calculated using DETX and DETY for each event in the final _common_clean file
| Quadrant A |  |
 |
Quadrant B |
|---|---|---|---|
| Quadrant D |  |
 |
Quadrant C |
| Plot type | Count rate plots | Images |
|---|---|---|
| Comparison with Poisson distribution Blue bars denote a histogram of data divided into 1 sec bins. Red curve is a Poisson curve with rate = median count rate of data. |
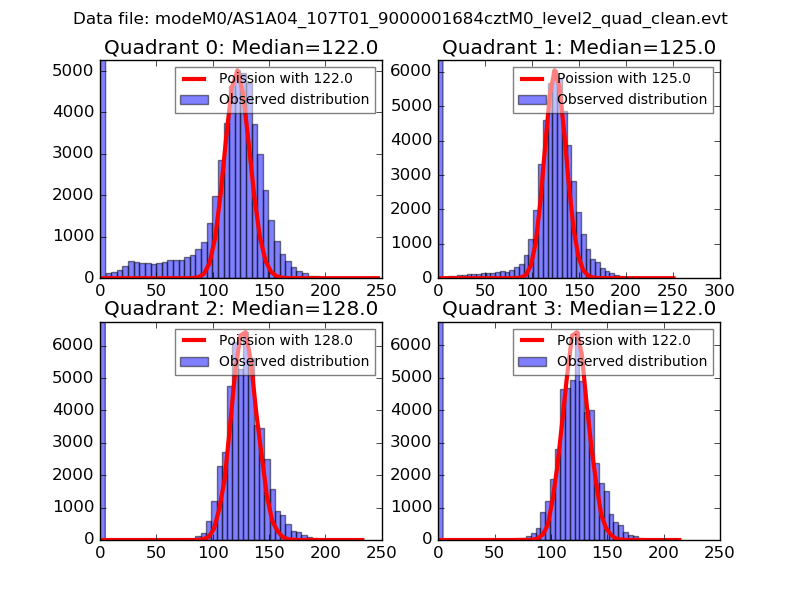 |
 |
| Quadrant-wise count rates Data is divided into 100 sec bins |
 |
|
| Module-wise count rates for Quadrant A Data is divided into 100 sec bins |
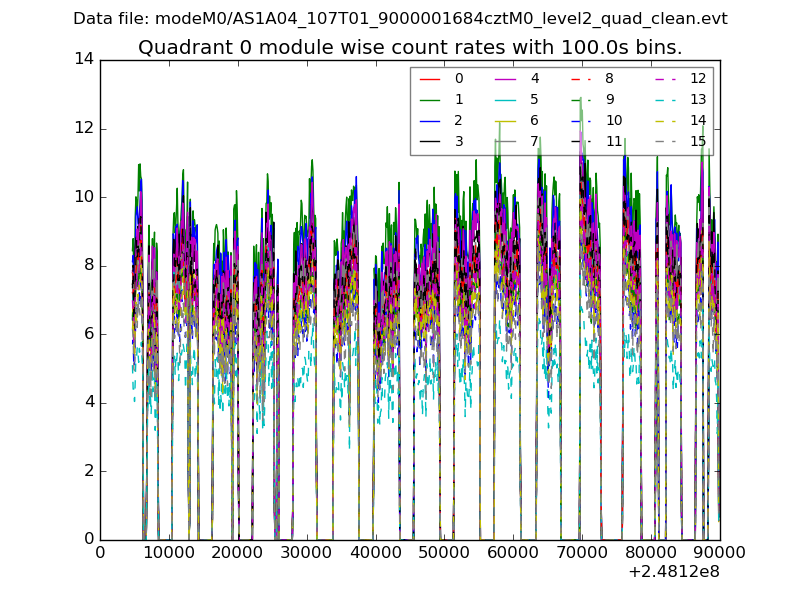 |
 |
| Module-wise count rates for Quadrant B Data is divided into 100 sec bins |
 |
 |
| Module-wise count rates for Quadrant C Data is divided into 100 sec bins |
 |
 |
| Module-wise count rates for Quadrant D Data is divided into 100 sec bins |
 |
 |
| Parameter | Plot |
|---|---|
| CZT HV Monitor |  |
| D_VDD |  |
| Temperature 1 | 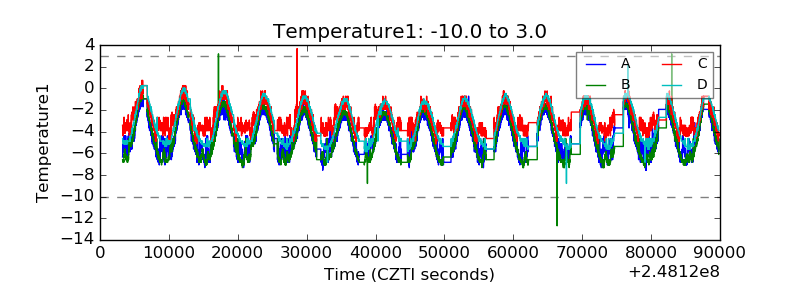 |
| Veto HV Monitor |  |
| Veto LLD |  |
| Alpha Counter | 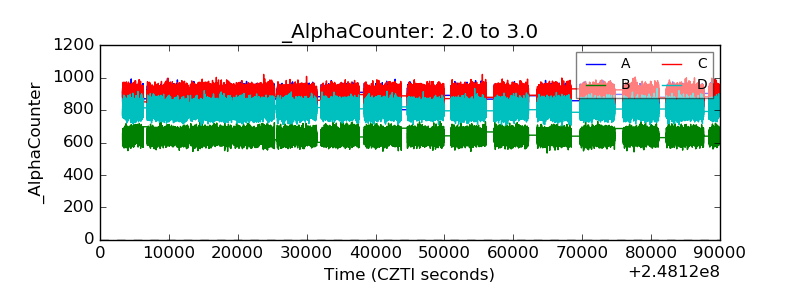 |
| _CPM_Rate |  |
| CZT Counter |  |
| +2.5 Volts monitor |  |
| +5 Volts monitor |  |
| _ROLL_ROT |  |
| _Roll_DEC | 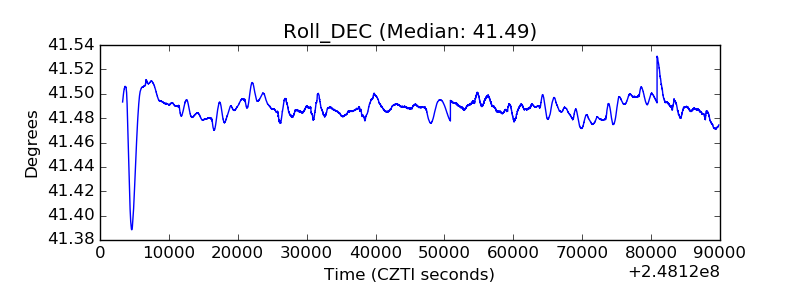 |
| _Roll_RA |  |
| Veto Counter | 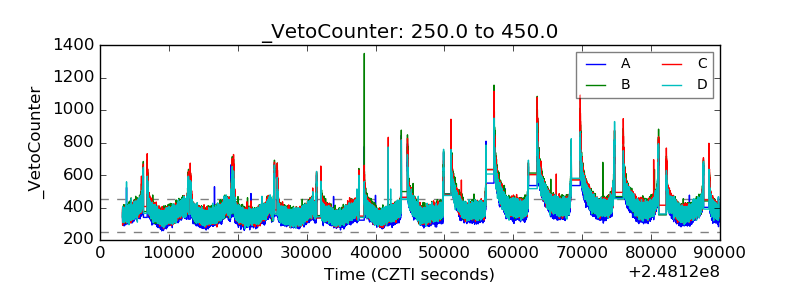 |