| Param | Original file | Final file |
|---|---|---|
| Filename | modeM0/AS1G08_032T01_9000001680cztM0_level2_bc.evt | modeM0/AS1G08_032T01_9000001680cztM0_level2_quad_clean.evt |
| Size (bytes) | 1,555,652,160 | 461,381,760 |
| Size | 1.4 GB | 440.0 MB |
| Events in quadrant A | 8,078,521 | 2,914,361 |
| Events in quadrant B | 15,480,205 | 2,797,456 |
| Events in quadrant C | 7,729,780 | 2,875,648 |
| Events in quadrant D | 13,183,519 | 2,727,909 |
| Mode M9 | |||
|---|---|---|---|
| Quadrant | BADHDUFLAG | Total packets | Discarded packets |
| A | 0 | 51 | 0 |
| B | 0 | 51 | 0 |
| C | 0 | 51 | 0 |
| D | 0 | 51 | 0 |
| Mode M0 | |||
|---|---|---|---|
| Quadrant | BADHDUFLAG | Total packets | Discarded packets |
| A | 0 | 81151 | 0 |
| B | 0 | 111648 | 0 |
| C | 0 | 79921 | 0 |
| D | 0 | 98584 | 0 |
| Mode SS | |||
|---|---|---|---|
| Quadrant | BADHDUFLAG | Total packets | Discarded packets |
| A | 0 | 788 | 0 |
| B | 0 | 788 | 0 |
| C | 0 | 788 | 0 |
| D | 0 | 788 | 0 |
| Quadrant | Total seconds | Saturated seconds | Saturation percentage |
|---|---|---|---|
| A | 38712 | 453 | 1.170180% |
| B | 38712 | 2881 | 7.442137% |
| C | 38712 | 278 | 0.718124% |
| D | 38712 | 1538 | 3.972928% |
Noise dominated data is calculated using 1-second bins in cleaned event files. If a bin has >2000 counts, and if more than 50% of those come from <1% of pixels, then it is considered to be noise-dominated and hence unusable.
| Quadrant | # 1 sec bins | Bins with >0 counts | Bins with >2000 counts | High rate bins dominated by noise | Noise dominated (total time) | Noise dominated (detector-on time) | Marked lightcurve |
|---|---|---|---|---|---|---|---|
| A | 43863 | 38717 | 4 | 4 | 0.01% | 0.01% |  |
| B | 43863 | 38713 | 160 | 160 | 0.36% | 0.41% |  |
| C | 43863 | 38716 | 3 | 3 | 0.01% | 0.01% |  |
| D | 43863 | 38710 | 165 | 165 | 0.38% | 0.43% |  |
Top three noisy pixels from each quadrant. If the there are fewer than three noisy pixels in the level2.evt file, extra rows are filled as -1
| Pixel properties | Quadrant properties | ||||||
|---|---|---|---|---|---|---|---|
| Quadrant | DetID | PixID | Counts | Sigma | Mean | Median | Sigma |
| A | 9 | 143 | 106198 | 240.24 | 1977 | 1944 | 434.0 |
| A | 14 | 235 | 68355 | 153.04 | 1977 | 1944 | 434.0 |
| A | 13 | 248 | 55481 | 123.37 | 1977 | 1944 | 434.0 |
| B | 4 | 239 | 3637438 | 9972.83 | 1904 | 1852 | 364.5 |
| B | 3 | 64 | 2340754 | 6415.88 | 1904 | 1852 | 364.5 |
| B | 15 | 204 | 1099695 | 3011.51 | 1904 | 1852 | 364.5 |
| C | 3 | 9 | 79927 | 178.68 | 1938 | 1908 | 436.6 |
| C | 12 | 4 | 24198 | 51.05 | 1938 | 1908 | 436.6 |
| C | 5 | 239 | 20961 | 43.64 | 1938 | 1908 | 436.6 |
| D | 1 | 52 | 2844659 | 6244.39 | 1933 | 1868 | 455.3 |
| D | 13 | 104 | 612890 | 1342.15 | 1933 | 1868 | 455.3 |
| D | 10 | 253 | 490660 | 1073.67 | 1933 | 1868 | 455.3 |
Histogram calculated using DETX and DETY for each event in the final _common_clean file
| Quadrant A |  |
 |
Quadrant B |
|---|---|---|---|
| Quadrant D |  |
 |
Quadrant C |
| Plot type | Count rate plots | Images |
|---|---|---|
| Comparison with Poisson distribution Blue bars denote a histogram of data divided into 1 sec bins. Red curve is a Poisson curve with rate = median count rate of data. |
 |
 |
| Quadrant-wise count rates Data is divided into 100 sec bins |
 |
|
| Module-wise count rates for Quadrant A Data is divided into 100 sec bins |
 |
 |
| Module-wise count rates for Quadrant B Data is divided into 100 sec bins |
 |
 |
| Module-wise count rates for Quadrant C Data is divided into 100 sec bins |
 |
 |
| Module-wise count rates for Quadrant D Data is divided into 100 sec bins |
 |
 |
| Parameter | Plot |
|---|---|
| CZT HV Monitor |  |
| D_VDD |  |
| Temperature 1 |  |
| Veto HV Monitor | 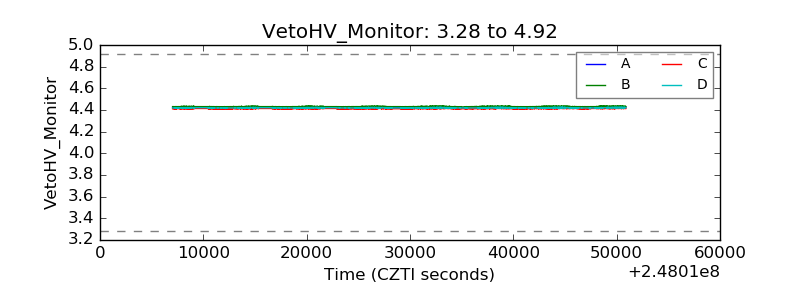 |
| Veto LLD |  |
| Alpha Counter |  |
| _CPM_Rate |  |
| CZT Counter |  |
| +2.5 Volts monitor | 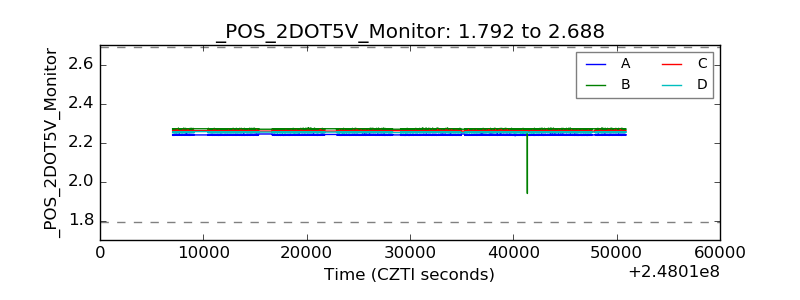 |
| +5 Volts monitor |  |
| _ROLL_ROT |  |
| _Roll_DEC |  |
| _Roll_RA |  |
| Veto Counter |  |