| Param | Original file | Final file |
|---|---|---|
| Filename | modeM0/AS1A04_021T03_9000001678cztM0_level2_bc.evt | modeM0/AS1A04_021T03_9000001678cztM0_level2_quad_clean.evt |
| Size (bytes) | 2,745,694,080 | 836,789,760 |
| Size | 2.6 GB | 798.0 MB |
| Events in quadrant A | 13,870,645 | 5,234,693 |
| Events in quadrant B | 24,590,141 | 5,089,001 |
| Events in quadrant C | 13,049,675 | 5,589,091 |
| Events in quadrant D | 27,207,290 | 4,966,645 |
| Mode M9 | |||
|---|---|---|---|
| Quadrant | BADHDUFLAG | Total packets | Discarded packets |
| A | 0 | 93 | 0 |
| B | 0 | 93 | 0 |
| C | 0 | 93 | 0 |
| D | 0 | 93 | 0 |
| Mode SS | |||
|---|---|---|---|
| Quadrant | BADHDUFLAG | Total packets | Discarded packets |
| A | 0 | 1322 | 0 |
| B | 0 | 1322 | 0 |
| C | 0 | 1322 | 0 |
| D | 0 | 1322 | 0 |
| Mode M0 | |||
|---|---|---|---|
| Quadrant | BADHDUFLAG | Total packets | Discarded packets |
| A | 0 | 138230 | 0 |
| B | 0 | 183046 | 0 |
| C | 0 | 133512 | 0 |
| D | 0 | 193872 | 0 |
| Quadrant | Total seconds | Saturated seconds | Saturation percentage |
|---|---|---|---|
| A | 65107 | 718 | 1.102800% |
| B | 65107 | 4423 | 6.793432% |
| C | 65107 | 396 | 0.608230% |
| D | 65107 | 6272 | 9.633373% |
Noise dominated data is calculated using 1-second bins in cleaned event files. If a bin has >2000 counts, and if more than 50% of those come from <1% of pixels, then it is considered to be noise-dominated and hence unusable.
| Quadrant | # 1 sec bins | Bins with >0 counts | Bins with >2000 counts | High rate bins dominated by noise | Noise dominated (total time) | Noise dominated (detector-on time) | Marked lightcurve |
|---|---|---|---|---|---|---|---|
| A | 74273 | 65108 | 6 | 6 | 0.01% | 0.01% |  |
| B | 74273 | 65107 | 163 | 163 | 0.22% | 0.25% |  |
| C | 74273 | 65113 | 0 | 0 | 0.00% | 0.00% | 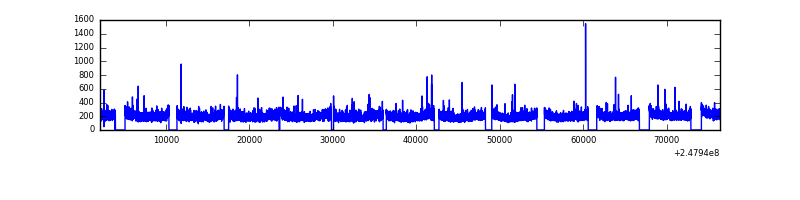 |
| D | 74273 | 65095 | 951 | 951 | 1.28% | 1.46% |  |
Top three noisy pixels from each quadrant. If the there are fewer than three noisy pixels in the level2.evt file, extra rows are filled as -1
| Pixel properties | Quadrant properties | ||||||
|---|---|---|---|---|---|---|---|
| Quadrant | DetID | PixID | Counts | Sigma | Mean | Median | Sigma |
| A | 8 | 5 | 406154 | 563.16 | 3270 | 3206 | 715.5 |
| A | 1 | 162 | 236531 | 326.09 | 3270 | 3206 | 715.5 |
| A | 9 | 143 | 215837 | 297.17 | 3270 | 3206 | 715.5 |
| B | 4 | 239 | 7798341 | 12887.6 | 3197 | 3113 | 604.9 |
| B | 3 | 64 | 1568805 | 2588.51 | 3197 | 3113 | 604.9 |
| B | 15 | 204 | 905860 | 1492.48 | 3197 | 3113 | 604.9 |
| C | 14 | 234 | 20964 | 22.53 | 3328 | 3248 | 786.2 |
| C | 13 | 61 | 19527 | 20.71 | 3328 | 3248 | 786.2 |
| C | 8 | 128 | 12785 | 12.13 | 3328 | 3248 | 786.2 |
| D | 1 | 52 | 8659411 | 11671.57 | 3143 | 3017 | 741.7 |
| D | 10 | 253 | 2308101 | 3107.98 | 3143 | 3017 | 741.7 |
| D | 8 | 195 | 1484810 | 1997.93 | 3143 | 3017 | 741.7 |
Histogram calculated using DETX and DETY for each event in the final _common_clean file
| Quadrant A |  |
 |
Quadrant B |
|---|---|---|---|
| Quadrant D |  |
 |
Quadrant C |
| Plot type | Count rate plots | Images |
|---|---|---|
| Comparison with Poisson distribution Blue bars denote a histogram of data divided into 1 sec bins. Red curve is a Poisson curve with rate = median count rate of data. |
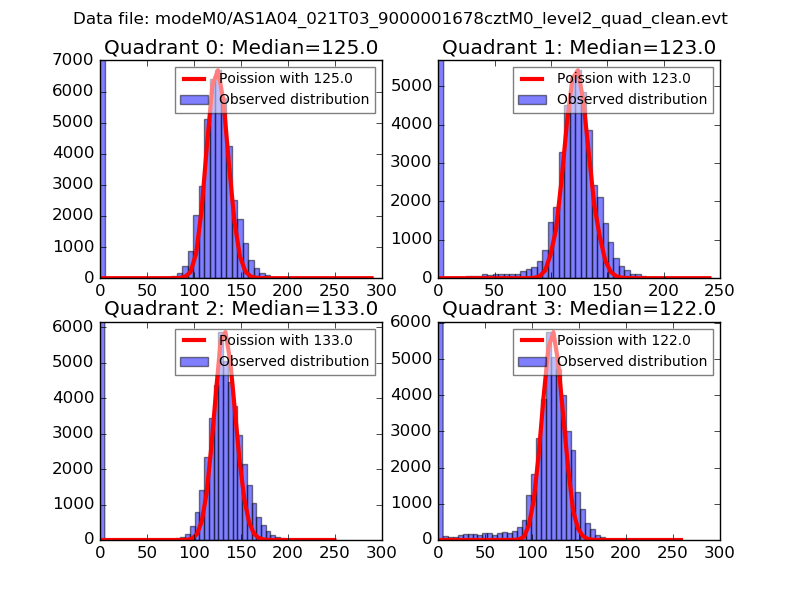 |
 |
| Quadrant-wise count rates Data is divided into 100 sec bins |
 |
|
| Module-wise count rates for Quadrant A Data is divided into 100 sec bins |
 |
 |
| Module-wise count rates for Quadrant B Data is divided into 100 sec bins |
 |
 |
| Module-wise count rates for Quadrant C Data is divided into 100 sec bins |
 |
 |
| Module-wise count rates for Quadrant D Data is divided into 100 sec bins |
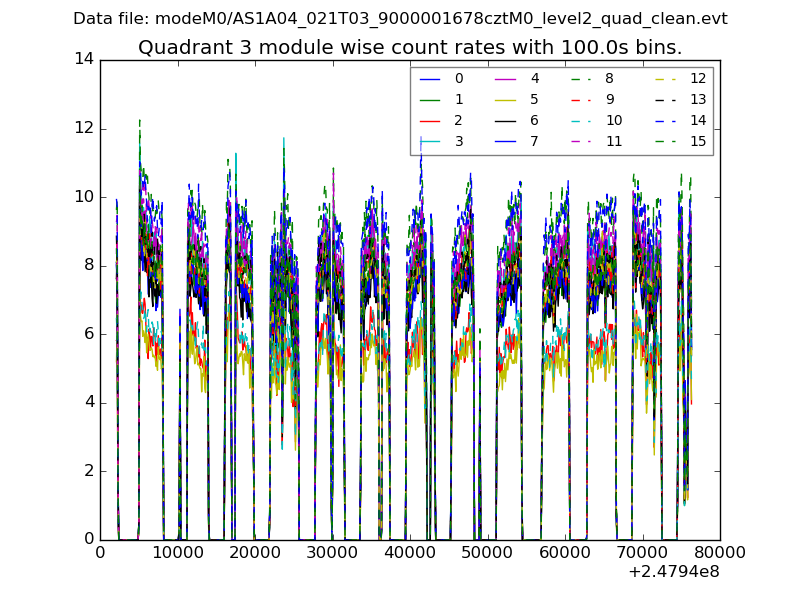 |
 |
| Parameter | Plot |
|---|---|
| CZT HV Monitor |  |
| D_VDD |  |
| Temperature 1 |  |
| Veto HV Monitor | 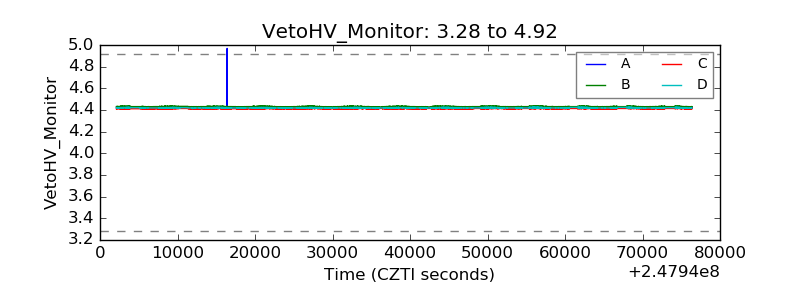 |
| Veto LLD |  |
| Alpha Counter |  |
| _CPM_Rate |  |
| CZT Counter |  |
| +2.5 Volts monitor |  |
| +5 Volts monitor |  |
| _ROLL_ROT |  |
| _Roll_DEC |  |
| _Roll_RA |  |
| Veto Counter | 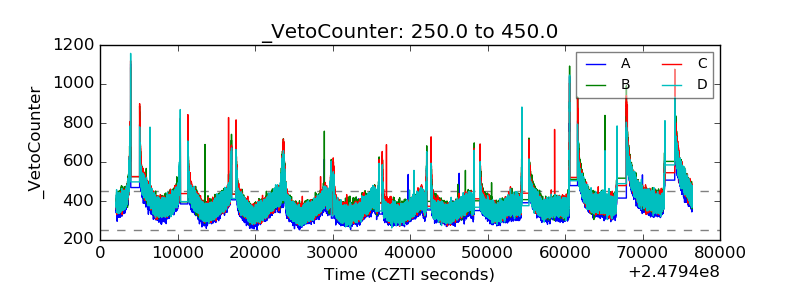 |