| Param | Original file | Final file |
|---|---|---|
| Filename | modeM0/AS1A04_021T02_9000001676cztM0_level2_bc.evt | modeM0/AS1A04_021T02_9000001676cztM0_level2_quad_clean.evt |
| Size (bytes) | 2,360,240,640 | 841,210,560 |
| Size | 2.2 GB | 802.2 MB |
| Events in quadrant A | 13,207,859 | 5,272,757 |
| Events in quadrant B | 21,638,743 | 5,147,672 |
| Events in quadrant C | 12,521,749 | 5,638,378 |
| Events in quadrant D | 19,922,518 | 5,204,645 |
| Mode M9 | |||
|---|---|---|---|
| Quadrant | BADHDUFLAG | Total packets | Discarded packets |
| A | 0 | 84 | 0 |
| B | 0 | 84 | 0 |
| C | 0 | 84 | 0 |
| D | 0 | 84 | 0 |
| Mode M0 | |||
|---|---|---|---|
| Quadrant | BADHDUFLAG | Total packets | Discarded packets |
| A | 0 | 133802 | 0 |
| B | 0 | 166357 | 0 |
| C | 0 | 126277 | 0 |
| D | 0 | 151199 | 0 |
| Mode SS | |||
|---|---|---|---|
| Quadrant | BADHDUFLAG | Total packets | Discarded packets |
| A | 0 | 1252 | 0 |
| B | 0 | 1252 | 0 |
| C | 0 | 1252 | 0 |
| D | 0 | 1252 | 0 |
| Quadrant | Total seconds | Saturated seconds | Saturation percentage |
|---|---|---|---|
| A | 61465 | 797 | 1.296673% |
| B | 61465 | 3717 | 6.047344% |
| C | 61465 | 473 | 0.769544% |
| D | 61465 | 2074 | 3.374278% |
Noise dominated data is calculated using 1-second bins in cleaned event files. If a bin has >2000 counts, and if more than 50% of those come from <1% of pixels, then it is considered to be noise-dominated and hence unusable.
| Quadrant | # 1 sec bins | Bins with >0 counts | Bins with >2000 counts | High rate bins dominated by noise | Noise dominated (total time) | Noise dominated (detector-on time) | Marked lightcurve |
|---|---|---|---|---|---|---|---|
| A | 69901 | 61470 | 6 | 6 | 0.01% | 0.01% |  |
| B | 69901 | 61467 | 60 | 60 | 0.09% | 0.10% |  |
| C | 69901 | 61467 | 1 | 1 | 0.00% | 0.00% |  |
| D | 69901 | 61464 | 598 | 598 | 0.86% | 0.97% | 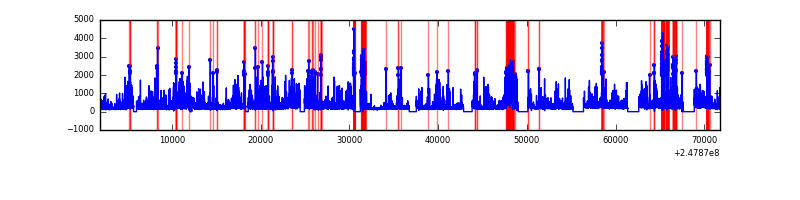 |
Top three noisy pixels from each quadrant. If the there are fewer than three noisy pixels in the level2.evt file, extra rows are filled as -1
| Pixel properties | Quadrant properties | ||||||
|---|---|---|---|---|---|---|---|
| Quadrant | DetID | PixID | Counts | Sigma | Mean | Median | Sigma |
| A | 1 | 162 | 528820 | 783.57 | 3102 | 3040 | 671.0 |
| A | 9 | 143 | 247784 | 364.74 | 3102 | 3040 | 671.0 |
| A | 15 | 174 | 186530 | 273.46 | 3102 | 3040 | 671.0 |
| B | 4 | 239 | 6974558 | 12055.25 | 3054 | 2975 | 578.3 |
| B | 15 | 204 | 719793 | 1239.52 | 3054 | 2975 | 578.3 |
| B | 11 | 51 | 391337 | 671.55 | 3054 | 2975 | 578.3 |
| C | 14 | 234 | 41124 | 50.74 | 3175 | 3113 | 749.2 |
| C | 8 | 128 | 28560 | 33.97 | 3175 | 3113 | 749.2 |
| C | 12 | 4 | 27520 | 32.58 | 3175 | 3113 | 749.2 |
| D | 1 | 52 | 3871573 | 5309.83 | 3114 | 2994 | 728.6 |
| D | 13 | 104 | 573999 | 783.73 | 3114 | 2994 | 728.6 |
| D | 10 | 253 | 496506 | 677.37 | 3114 | 2994 | 728.6 |
Histogram calculated using DETX and DETY for each event in the final _common_clean file
| Quadrant A |  |
 |
Quadrant B |
|---|---|---|---|
| Quadrant D |  |
 |
Quadrant C |
| Plot type | Count rate plots | Images |
|---|---|---|
| Comparison with Poisson distribution Blue bars denote a histogram of data divided into 1 sec bins. Red curve is a Poisson curve with rate = median count rate of data. |
 |
 |
| Quadrant-wise count rates Data is divided into 100 sec bins |
 |
|
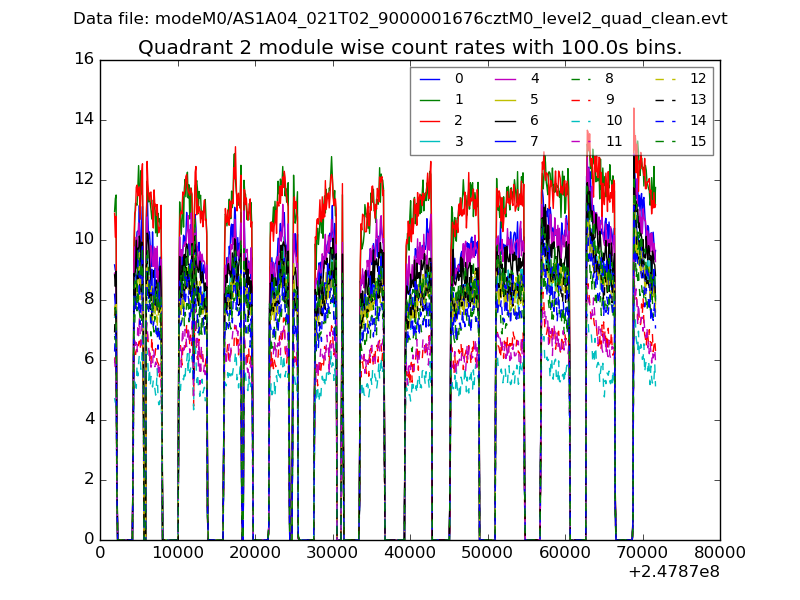
| Module-wise count rates for Quadrant A Data is divided into 100 sec bins |
 |
 |
| Module-wise count rates for Quadrant B Data is divided into 100 sec bins |
 |
 |
| Module-wise count rates for Quadrant C Data is divided into 100 sec bins |
 |
 |
| Module-wise count rates for Quadrant D Data is divided into 100 sec bins |
 |
 |
| Parameter | Plot |
|---|---|
| CZT HV Monitor |  |
| D_VDD |  |
| Temperature 1 |  |
| Veto HV Monitor |  |
| Veto LLD |  |
| Alpha Counter |  |
| _CPM_Rate |  |
| CZT Counter |  |
| +2.5 Volts monitor |  |
| +5 Volts monitor |  |
| _ROLL_ROT |  |
| _Roll_DEC |  |
| _Roll_RA |  |
| Veto Counter |  |