| Param | Original file | Final file |
|---|---|---|
| Filename | modeM0/AS1A04_024T04_9000001670cztM0_level2_bc.evt | modeM0/AS1A04_024T04_9000001670cztM0_level2_quad_clean.evt |
| Size (bytes) | 3,368,620,800 | 1,026,141,120 |
| Size | 3.1 GB | 978.6 MB |
| Events in quadrant A | 22,890,798 | 6,556,940 |
| Events in quadrant B | 31,661,198 | 6,459,014 |
| Events in quadrant C | 15,202,306 | 6,598,701 |
| Events in quadrant D | 27,076,544 | 6,239,420 |
| Mode M0 | |||
|---|---|---|---|
| Quadrant | BADHDUFLAG | Total packets | Discarded packets |
| A | 0 | 188417 | 0 |
| B | 0 | 225222 | 0 |
| C | 0 | 155993 | 0 |
| D | 0 | 195212 | 0 |
| Mode M9 | |||
|---|---|---|---|
| Quadrant | BADHDUFLAG | Total packets | Discarded packets |
| A | 0 | 113 | 0 |
| B | 0 | 113 | 0 |
| C | 0 | 113 | 0 |
| D | 0 | 113 | 0 |
| Mode SS | |||
|---|---|---|---|
| Quadrant | BADHDUFLAG | Total packets | Discarded packets |
| A | 0 | 1548 | 0 |
| B | 0 | 1548 | 0 |
| C | 0 | 1548 | 0 |
| D | 0 | 1548 | 0 |
| Quadrant | Total seconds | Saturated seconds | Saturation percentage |
|---|---|---|---|
| A | 76218 | 2411 | 3.163295% |
| B | 76218 | 6685 | 8.770894% |
| C | 76218 | 447 | 0.586476% |
| D | 76218 | 2518 | 3.303682% |
Noise dominated data is calculated using 1-second bins in cleaned event files. If a bin has >2000 counts, and if more than 50% of those come from <1% of pixels, then it is considered to be noise-dominated and hence unusable.
| Quadrant | # 1 sec bins | Bins with >0 counts | Bins with >2000 counts | High rate bins dominated by noise | Noise dominated (total time) | Noise dominated (detector-on time) | Marked lightcurve |
|---|---|---|---|---|---|---|---|
| A | 87494 | 76220 | 101 | 101 | 0.12% | 0.13% |  |
| B | 87494 | 76219 | 281 | 281 | 0.32% | 0.37% |  |
| C | 87494 | 76223 | 2 | 2 | 0.00% | 0.00% |  |
| D | 87494 | 76219 | 459 | 459 | 0.52% | 0.60% |  |
Top three noisy pixels from each quadrant. If the there are fewer than three noisy pixels in the level2.evt file, extra rows are filled as -1
| Pixel properties | Quadrant properties | ||||||
|---|---|---|---|---|---|---|---|
| Quadrant | DetID | PixID | Counts | Sigma | Mean | Median | Sigma |
| A | 8 | 5 | 7005900 | 8184.53 | 3906 | 3840 | 855.5 |
| A | 1 | 162 | 219423 | 251.99 | 3906 | 3840 | 855.5 |
| A | 13 | 251 | 176255 | 201.53 | 3906 | 3840 | 855.5 |
| B | 4 | 239 | 10202546 | 13855.02 | 3834 | 3743 | 736.1 |
| B | 3 | 64 | 3381667 | 4588.89 | 3834 | 3743 | 736.1 |
| B | 15 | 204 | 844434 | 1142.07 | 3834 | 3743 | 736.1 |
| C | 0 | 207 | 40332 | 42.85 | 3856 | 3825 | 851.9 |
| C | 12 | 4 | 30919 | 31.8 | 3856 | 3825 | 851.9 |
| C | 13 | 61 | 23669 | 23.29 | 3856 | 3825 | 851.9 |
| D | 1 | 52 | 3838951 | 4218.67 | 3859 | 3735 | 909.1 |
| D | 13 | 152 | 3784495 | 4158.77 | 3859 | 3735 | 909.1 |
| D | 10 | 253 | 803304 | 879.51 | 3859 | 3735 | 909.1 |
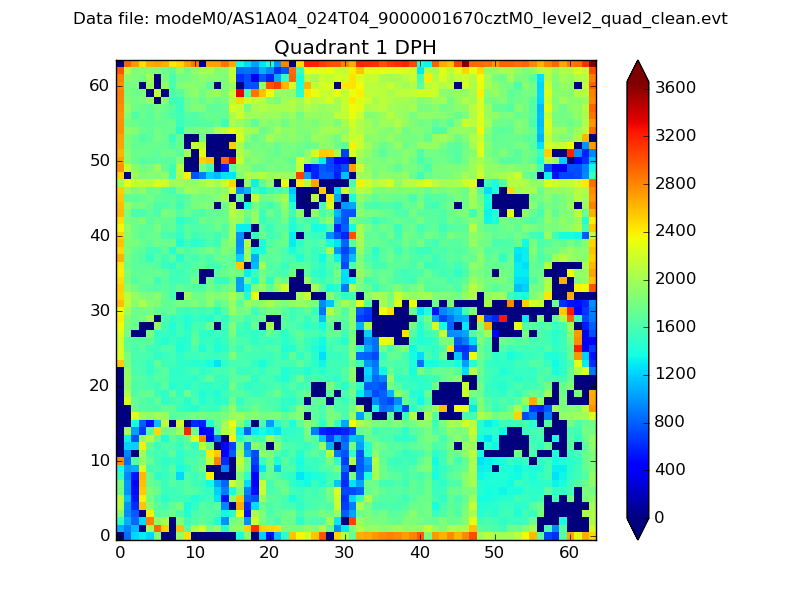
Histogram calculated using DETX and DETY for each event in the final _common_clean file
| Quadrant A |  |
 |
Quadrant B |
|---|---|---|---|
| Quadrant D | 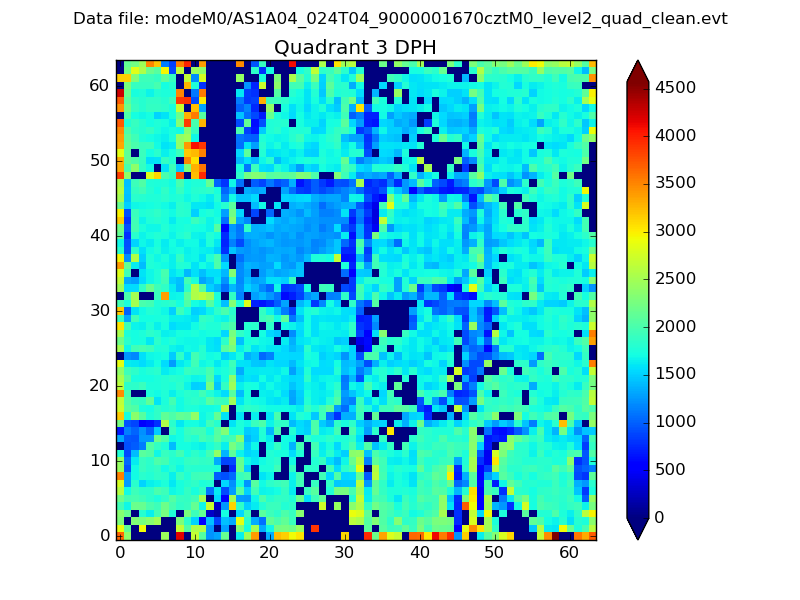 |
 |
Quadrant C |
| Plot type | Count rate plots | Images |
|---|---|---|
| Comparison with Poisson distribution Blue bars denote a histogram of data divided into 1 sec bins. Red curve is a Poisson curve with rate = median count rate of data. |
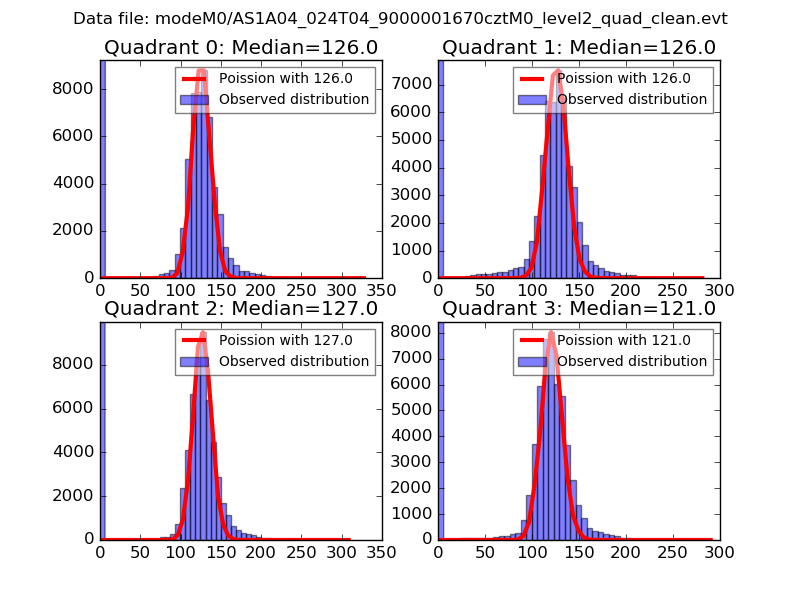 |
 |
| Quadrant-wise count rates Data is divided into 100 sec bins |
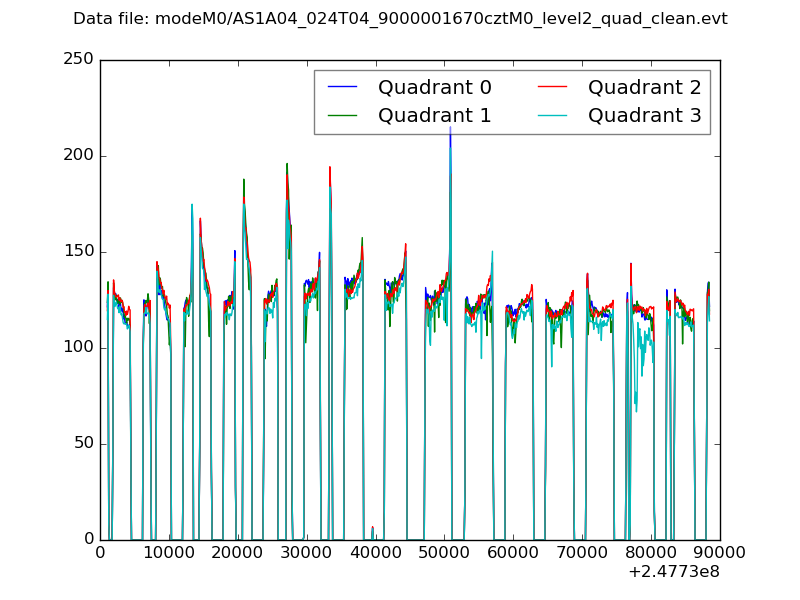 |
|
| Module-wise count rates for Quadrant A Data is divided into 100 sec bins |
 |
 |
| Module-wise count rates for Quadrant B Data is divided into 100 sec bins |
 |
 |
| Module-wise count rates for Quadrant C Data is divided into 100 sec bins |
 |
 |
| Module-wise count rates for Quadrant D Data is divided into 100 sec bins |
 |
 |
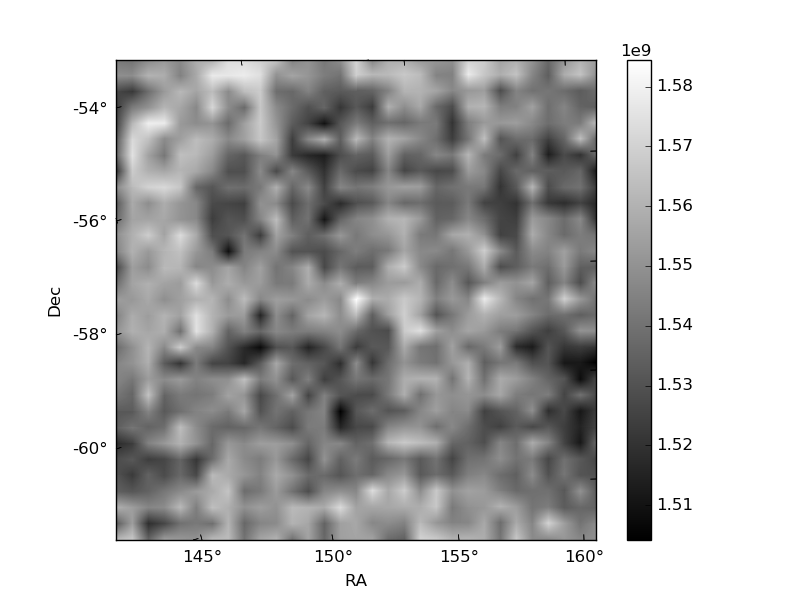
| Parameter | Plot |
|---|---|
| CZT HV Monitor |  |
| D_VDD | 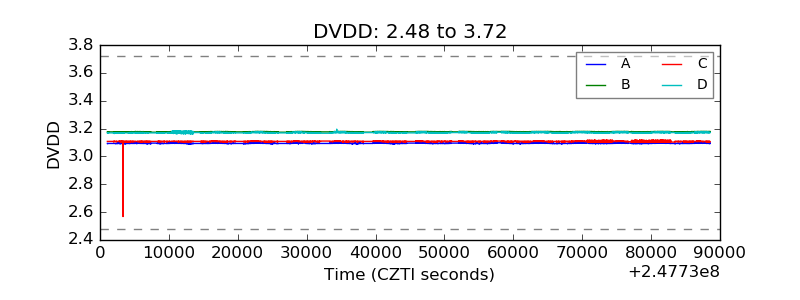 |
| Temperature 1 | 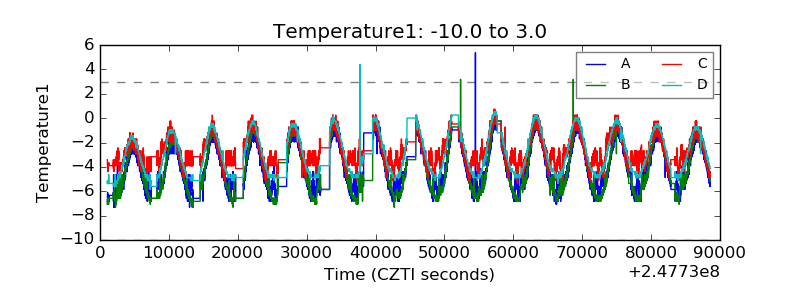 |
| Veto HV Monitor | 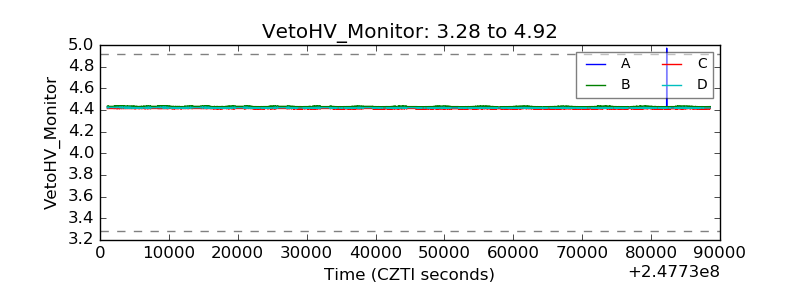 |
| Veto LLD | 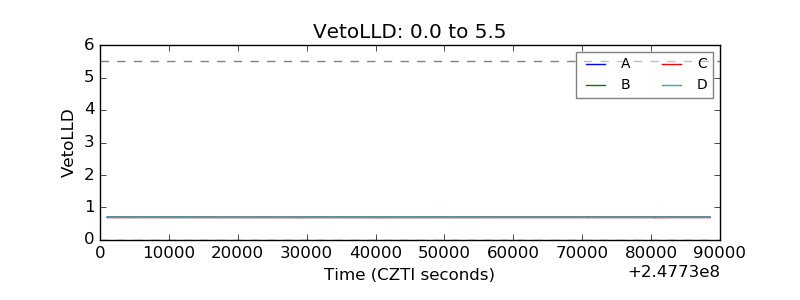 |
| Alpha Counter |  |
| _CPM_Rate |  |
| CZT Counter | 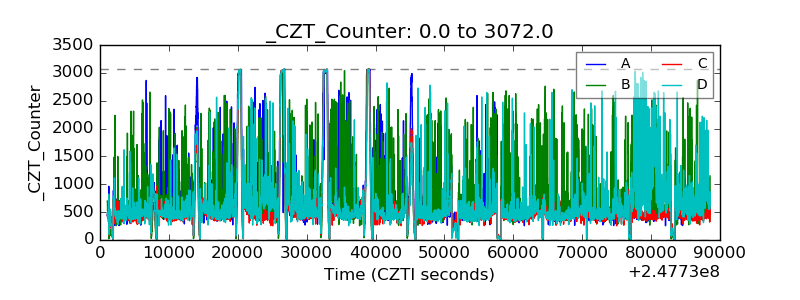 |
| +2.5 Volts monitor |  |
| +5 Volts monitor |  |
| _ROLL_ROT | 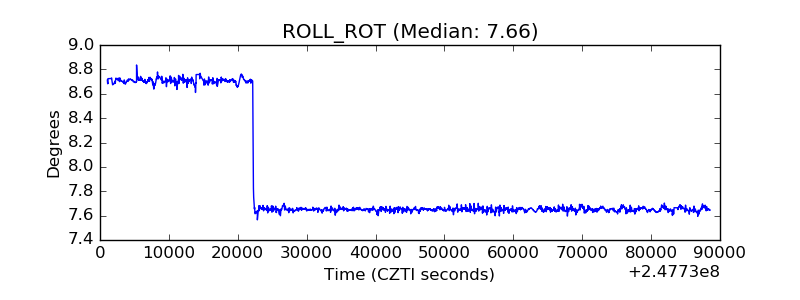 |
| _Roll_DEC |  |
| _Roll_RA |  |
| Veto Counter |  |