| Param | Original file | Final file |
|---|---|---|
| Filename | modeM0/AS1G08_066T01_9000001668cztM0_level2_bc.evt | modeM0/AS1G08_066T01_9000001668cztM0_level2_quad_clean.evt |
| Size (bytes) | 1,604,499,840 | 541,739,520 |
| Size | 1.5 GB | 516.6 MB |
| Events in quadrant A | 9,772,164 | 3,412,673 |
| Events in quadrant B | 15,473,045 | 3,326,208 |
| Events in quadrant C | 8,615,756 | 3,357,047 |
| Events in quadrant D | 11,638,062 | 3,200,940 |
| Mode M0 | |||
|---|---|---|---|
| Quadrant | BADHDUFLAG | Total packets | Discarded packets |
| A | 0 | 96546 | 0 |
| B | 0 | 120810 | 0 |
| C | 0 | 92819 | 0 |
| D | 0 | 103386 | 0 |
| Mode SS | |||
|---|---|---|---|
| Quadrant | BADHDUFLAG | Total packets | Discarded packets |
| A | 0 | 926 | 0 |
| B | 0 | 926 | 0 |
| C | 0 | 926 | 0 |
| D | 0 | 926 | 0 |
| Mode M9 | |||
|---|---|---|---|
| Quadrant | BADHDUFLAG | Total packets | Discarded packets |
| A | 0 | 58 | 0 |
| B | 0 | 58 | 0 |
| C | 0 | 58 | 0 |
| D | 0 | 58 | 0 |
| Quadrant | Total seconds | Saturated seconds | Saturation percentage |
|---|---|---|---|
| A | 45312 | 546 | 1.204979% |
| B | 45312 | 2813 | 6.208069% |
| C | 45312 | 262 | 0.578213% |
| D | 45312 | 1038 | 2.290784% |
Noise dominated data is calculated using 1-second bins in cleaned event files. If a bin has >2000 counts, and if more than 50% of those come from <1% of pixels, then it is considered to be noise-dominated and hence unusable.
| Quadrant | # 1 sec bins | Bins with >0 counts | Bins with >2000 counts | High rate bins dominated by noise | Noise dominated (total time) | Noise dominated (detector-on time) | Marked lightcurve |
|---|---|---|---|---|---|---|---|
| A | 51239 | 45315 | 11 | 11 | 0.02% | 0.02% |  |
| B | 51239 | 45314 | 61 | 61 | 0.12% | 0.13% |  |
| C | 51239 | 45314 | 0 | 0 | 0.00% | 0.00% |  |
| D | 51239 | 45312 | 109 | 109 | 0.21% | 0.24% |  |
Top three noisy pixels from each quadrant. If the there are fewer than three noisy pixels in the level2.evt file, extra rows are filled as -1
| Pixel properties | Quadrant properties | ||||||
|---|---|---|---|---|---|---|---|
| Quadrant | DetID | PixID | Counts | Sigma | Mean | Median | Sigma |
| A | 8 | 5 | 813118 | 1626.12 | 2250 | 2200 | 498.7 |
| A | 11 | 29 | 135921 | 268.15 | 2250 | 2200 | 498.7 |
| A | 1 | 162 | 81951 | 159.92 | 2250 | 2200 | 498.7 |
| B | 4 | 239 | 5706436 | 13310.02 | 2230 | 2165 | 428.6 |
| B | 3 | 189 | 422073 | 979.79 | 2230 | 2165 | 428.6 |
| B | 3 | 64 | 210626 | 486.41 | 2230 | 2165 | 428.6 |
| C | 14 | 234 | 25707 | 48.62 | 2198 | 2162 | 484.3 |
| C | 13 | 61 | 12954 | 22.28 | 2198 | 2162 | 484.3 |
| C | 7 | 247 | 6333 | 8.61 | 2198 | 2162 | 484.3 |
| D | 10 | 253 | 836880 | 1654.71 | 2179 | 2099 | 504.5 |
| D | 13 | 152 | 795202 | 1572.1 | 2179 | 2099 | 504.5 |
| D | 2 | 120 | 341180 | 672.13 | 2179 | 2099 | 504.5 |
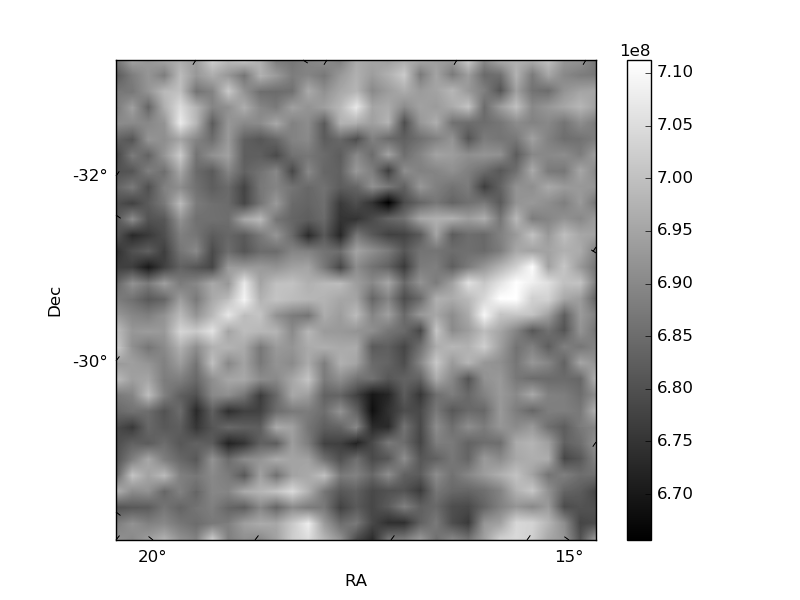
Histogram calculated using DETX and DETY for each event in the final _common_clean file
| Quadrant A |  |
 |
Quadrant B |
|---|---|---|---|
| Quadrant D |  |
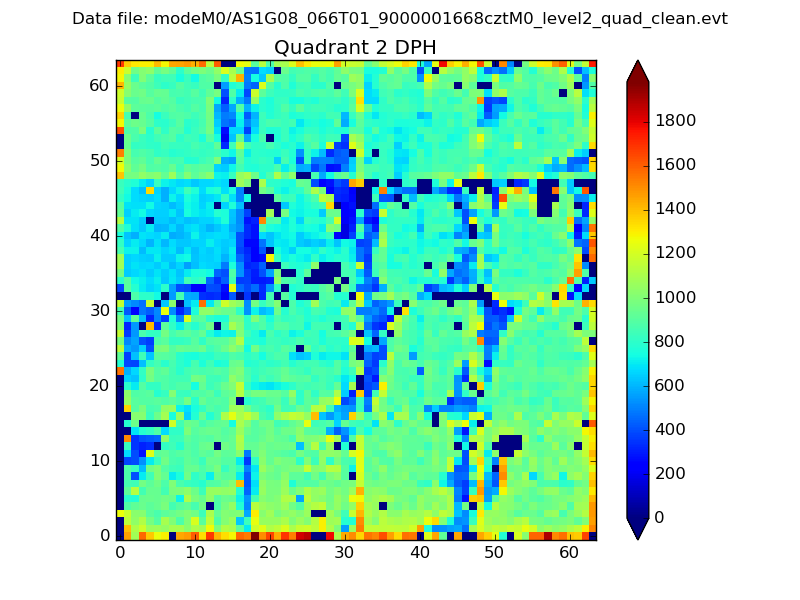 |
Quadrant C |
| Plot type | Count rate plots | Images |
|---|---|---|
| Comparison with Poisson distribution Blue bars denote a histogram of data divided into 1 sec bins. Red curve is a Poisson curve with rate = median count rate of data. |
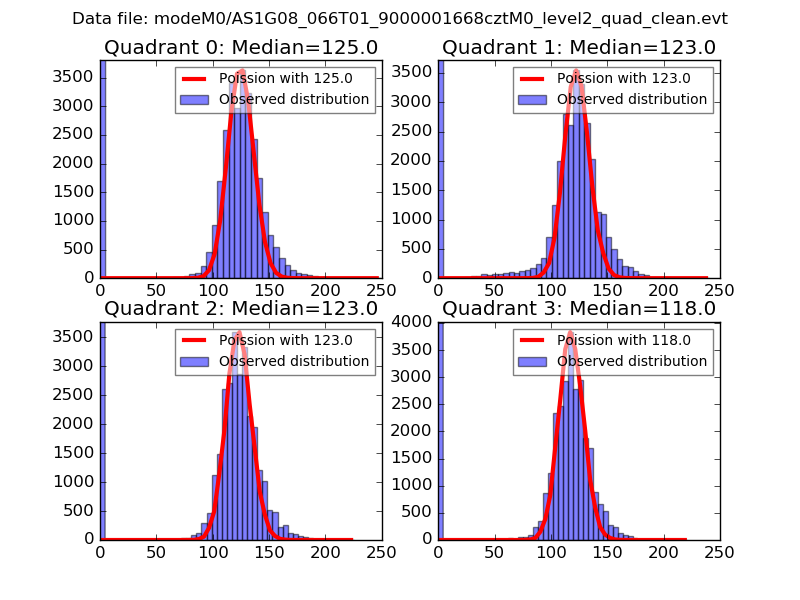 |
 |
| Quadrant-wise count rates Data is divided into 100 sec bins |
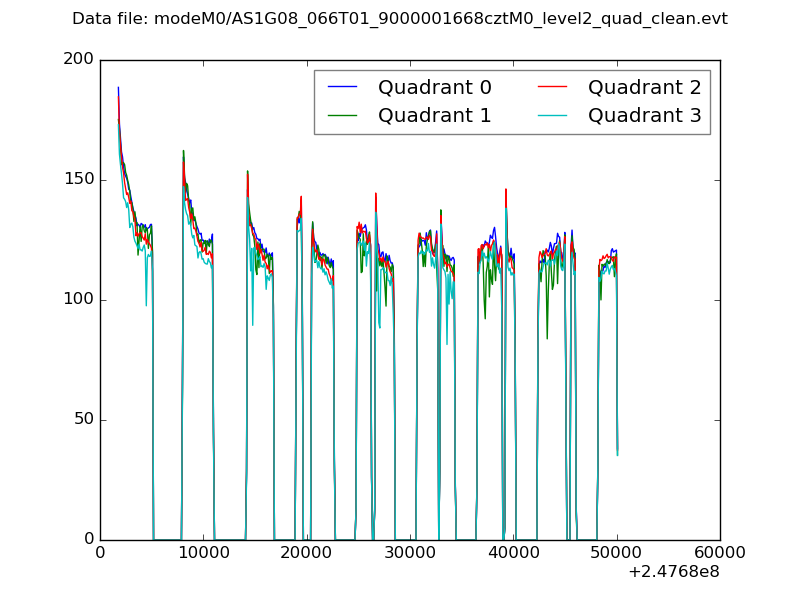 |
|
| Module-wise count rates for Quadrant A Data is divided into 100 sec bins |
 |
 |
| Module-wise count rates for Quadrant B Data is divided into 100 sec bins |
 |
 |
| Module-wise count rates for Quadrant C Data is divided into 100 sec bins |
 |
 |
| Module-wise count rates for Quadrant D Data is divided into 100 sec bins |
 |
 |
| Parameter | Plot |
|---|---|
| CZT HV Monitor |  |
| D_VDD |  |
| Temperature 1 | 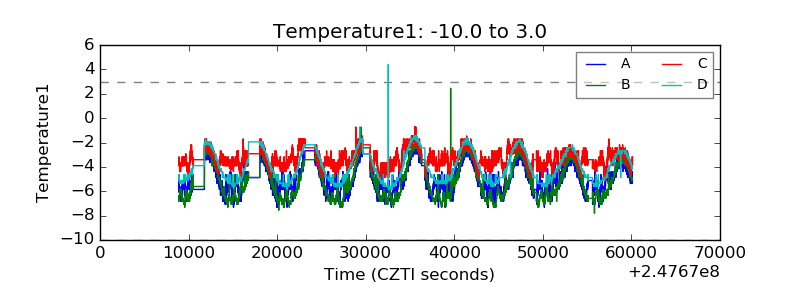 |
| Veto HV Monitor |  |
| Veto LLD |  |
| Alpha Counter |  |
| _CPM_Rate |  |
| CZT Counter |  |
| +2.5 Volts monitor | 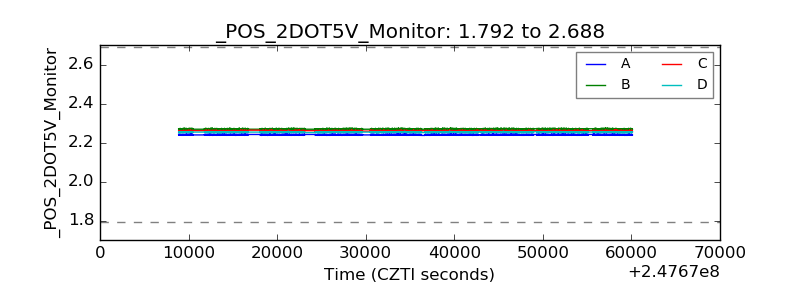 |
| +5 Volts monitor |  |
| _ROLL_ROT |  |
| _Roll_DEC |  |
| _Roll_RA |  |
| Veto Counter |  |