| Param | Original file | Final file |
|---|---|---|
| Filename | modeM0/AS1A04_022T03_9000001664cztM0_level2_bc.evt | modeM0/AS1A04_022T03_9000001664cztM0_level2_quad_clean.evt |
| Size (bytes) | 2,319,888,960 | 679,305,600 |
| Size | 2.2 GB | 647.8 MB |
| Events in quadrant A | 14,891,981 | 4,301,802 |
| Events in quadrant B | 18,034,159 | 4,149,125 |
| Events in quadrant C | 10,074,231 | 4,650,127 |
| Events in quadrant D | 23,929,494 | 4,119,504 |
| Mode SS | |||
|---|---|---|---|
| Quadrant | BADHDUFLAG | Total packets | Discarded packets |
| A | 0 | 998 | 0 |
| B | 0 | 998 | 0 |
| C | 0 | 998 | 0 |
| D | 0 | 998 | 0 |
| Mode M0 | |||
|---|---|---|---|
| Quadrant | BADHDUFLAG | Total packets | Discarded packets |
| A | 0 | 120237 | 0 |
| B | 0 | 136330 | 0 |
| C | 0 | 100574 | 0 |
| D | 0 | 151605 | 0 |
| Mode M9 | |||
|---|---|---|---|
| Quadrant | BADHDUFLAG | Total packets | Discarded packets |
| A | 0 | 95 | 0 |
| B | 0 | 95 | 0 |
| C | 0 | 95 | 0 |
| D | 0 | 95 | 0 |
| Quadrant | Total seconds | Saturated seconds | Saturation percentage |
|---|---|---|---|
| A | 48864 | 1840 | 3.765553% |
| B | 48864 | 4064 | 8.316961% |
| C | 48864 | 469 | 0.959807% |
| D | 48864 | 4093 | 8.376310% |
Noise dominated data is calculated using 1-second bins in cleaned event files. If a bin has >2000 counts, and if more than 50% of those come from <1% of pixels, then it is considered to be noise-dominated and hence unusable.
| Quadrant | # 1 sec bins | Bins with >0 counts | Bins with >2000 counts | High rate bins dominated by noise | Noise dominated (total time) | Noise dominated (detector-on time) | Marked lightcurve |
|---|---|---|---|---|---|---|---|
| A | 58275 | 48867 | 122 | 122 | 0.21% | 0.25% |  |
| B | 58275 | 48864 | 348 | 348 | 0.60% | 0.71% | 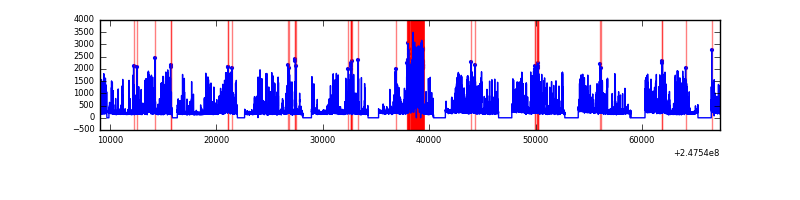 |
| C | 58275 | 48867 | 0 | 0 | 0.00% | 0.00% |  |
| D | 58275 | 48861 | 945 | 945 | 1.62% | 1.93% |  |
Top three noisy pixels from each quadrant. If the there are fewer than three noisy pixels in the level2.evt file, extra rows are filled as -1
| Pixel properties | Quadrant properties | ||||||
|---|---|---|---|---|---|---|---|
| Quadrant | DetID | PixID | Counts | Sigma | Mean | Median | Sigma |
| A | 8 | 5 | 4907296 | 9207.75 | 2483 | 2437 | 532.7 |
| A | 13 | 248 | 79178 | 144.06 | 2483 | 2437 | 532.7 |
| A | 1 | 162 | 70229 | 127.26 | 2483 | 2437 | 532.7 |
| B | 4 | 239 | 5564487 | 12083.45 | 2433 | 2367 | 460.3 |
| B | 4 | 81 | 1713869 | 3718.16 | 2433 | 2367 | 460.3 |
| B | 11 | 51 | 392028 | 846.52 | 2433 | 2367 | 460.3 |
| C | 13 | 61 | 14848 | 20.25 | 2571 | 2515 | 609.0 |
| C | 12 | 4 | 11639 | 14.98 | 2571 | 2515 | 609.0 |
| C | 14 | 234 | 10871 | 13.72 | 2571 | 2515 | 609.0 |
| D | 1 | 52 | 5807747 | 10048.63 | 2453 | 2360 | 577.7 |
| D | 10 | 253 | 2968487 | 5134.11 | 2453 | 2360 | 577.7 |
| D | 14 | 34 | 2886902 | 4992.89 | 2453 | 2360 | 577.7 |
Histogram calculated using DETX and DETY for each event in the final _common_clean file
| Quadrant A |  |
 |
Quadrant B |
|---|---|---|---|
| Quadrant D |  |
 |
Quadrant C |
| Plot type | Count rate plots | Images |
|---|---|---|
| Comparison with Poisson distribution Blue bars denote a histogram of data divided into 1 sec bins. Red curve is a Poisson curve with rate = median count rate of data. |
 |
 |
| Quadrant-wise count rates Data is divided into 100 sec bins |
 |
|
| Module-wise count rates for Quadrant A Data is divided into 100 sec bins |
 |
 |
| Module-wise count rates for Quadrant B Data is divided into 100 sec bins |
 |
 |
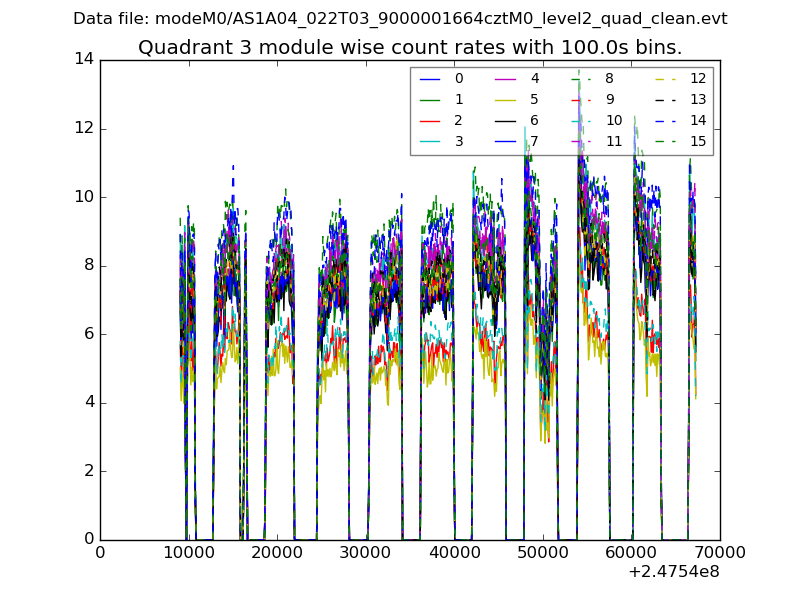
| Module-wise count rates for Quadrant C Data is divided into 100 sec bins |
 |
 |
| Module-wise count rates for Quadrant D Data is divided into 100 sec bins |
 |
 |
| Parameter | Plot |
|---|---|
| CZT HV Monitor |  |
| D_VDD | 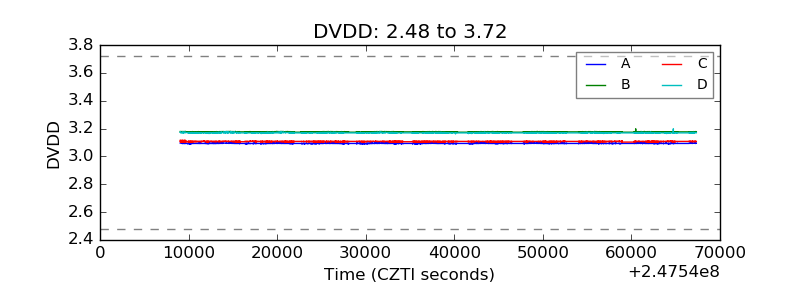 |
| Temperature 1 | 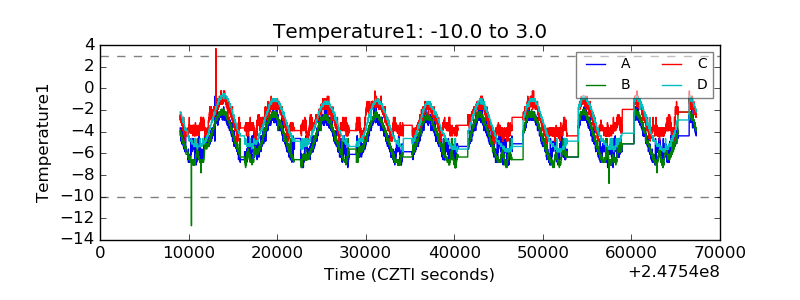 |
| Veto HV Monitor |  |
| Veto LLD |  |
| Alpha Counter |  |
| _CPM_Rate | 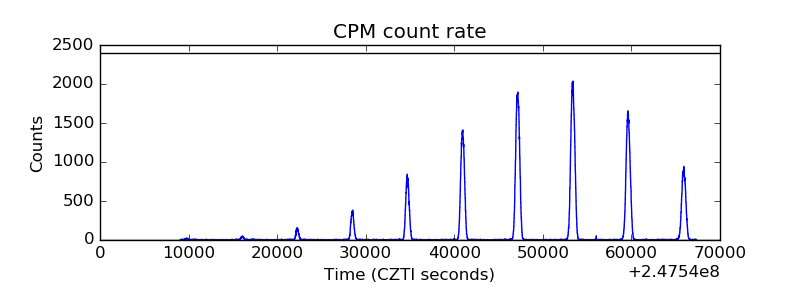 |
| CZT Counter |  |
| +2.5 Volts monitor | 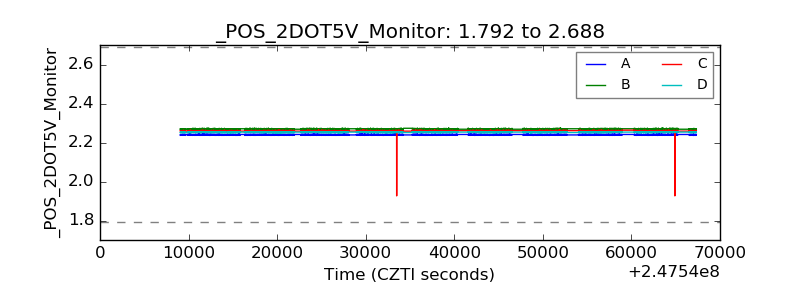 |
| +5 Volts monitor |  |
| _ROLL_ROT |  |
| _Roll_DEC | 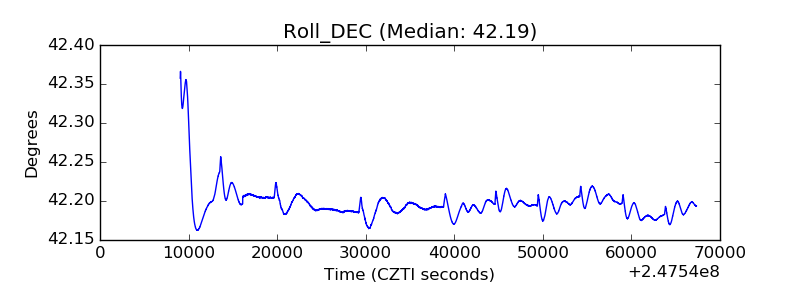 |
| _Roll_RA |  |
| Veto Counter |  |