| Param | Original file | Final file |
|---|---|---|
| Filename | modeM0/AS1A04_022T02_9000001662cztM0_level2_bc.evt | modeM0/AS1A04_022T02_9000001662cztM0_level2_quad_clean.evt |
| Size (bytes) | 2,415,075,840 | 729,469,440 |
| Size | 2.2 GB | 695.7 MB |
| Events in quadrant A | 16,101,100 | 4,540,880 |
| Events in quadrant B | 18,007,033 | 4,501,158 |
| Events in quadrant C | 11,412,539 | 4,922,788 |
| Events in quadrant D | 23,913,288 | 4,395,068 |
| Mode M9 | |||
|---|---|---|---|
| Quadrant | BADHDUFLAG | Total packets | Discarded packets |
| A | 0 | 96 | 0 |
| B | 0 | 96 | 0 |
| C | 0 | 96 | 0 |
| D | 0 | 96 | 0 |
| Mode M0 | |||
|---|---|---|---|
| Quadrant | BADHDUFLAG | Total packets | Discarded packets |
| A | 0 | 133008 | 0 |
| B | 0 | 141705 | 0 |
| C | 0 | 112814 | 0 |
| D | 0 | 157199 | 0 |
| Mode SS | |||
|---|---|---|---|
| Quadrant | BADHDUFLAG | Total packets | Discarded packets |
| A | 0 | 1106 | 0 |
| B | 0 | 1106 | 0 |
| C | 0 | 1106 | 0 |
| D | 0 | 1106 | 0 |
| Quadrant | Total seconds | Saturated seconds | Saturation percentage |
|---|---|---|---|
| A | 54430 | 1732 | 3.182069% |
| B | 54430 | 2990 | 5.493294% |
| C | 54430 | 437 | 0.802866% |
| D | 54430 | 3955 | 7.266213% |
Noise dominated data is calculated using 1-second bins in cleaned event files. If a bin has >2000 counts, and if more than 50% of those come from <1% of pixels, then it is considered to be noise-dominated and hence unusable.
| Quadrant | # 1 sec bins | Bins with >0 counts | Bins with >2000 counts | High rate bins dominated by noise | Noise dominated (total time) | Noise dominated (detector-on time) | Marked lightcurve |
|---|---|---|---|---|---|---|---|
| A | 63867 | 54432 | 64 | 64 | 0.10% | 0.12% |  |
| B | 63867 | 54431 | 73 | 73 | 0.11% | 0.13% |  |
| C | 63867 | 54433 | 5 | 5 | 0.01% | 0.01% |  |
| D | 63867 | 54422 | 1048 | 1048 | 1.64% | 1.93% |  |
Top three noisy pixels from each quadrant. If the there are fewer than three noisy pixels in the level2.evt file, extra rows are filled as -1
| Pixel properties | Quadrant properties | ||||||
|---|---|---|---|---|---|---|---|
| Quadrant | DetID | PixID | Counts | Sigma | Mean | Median | Sigma |
| A | 8 | 5 | 3012896 | 5048.77 | 2758 | 2706 | 596.2 |
| A | 15 | 174 | 1999009 | 3348.25 | 2758 | 2706 | 596.2 |
| A | 13 | 251 | 140794 | 231.6 | 2758 | 2706 | 596.2 |
| B | 4 | 239 | 4737461 | 9193.78 | 2745 | 2672 | 515.0 |
| B | 3 | 64 | 1463638 | 2836.83 | 2745 | 2672 | 515.0 |
| B | 3 | 189 | 354924 | 683.99 | 2745 | 2672 | 515.0 |
| C | 0 | 207 | 154440 | 223.75 | 2866 | 2808 | 677.7 |
| C | 14 | 234 | 18283 | 22.83 | 2866 | 2808 | 677.7 |
| C | 12 | 4 | 18122 | 22.6 | 2866 | 2808 | 677.7 |
| D | 1 | 52 | 3914672 | 5819.23 | 2718 | 2636 | 672.3 |
| D | 14 | 34 | 3880748 | 5768.77 | 2718 | 2636 | 672.3 |
| D | 10 | 253 | 2265048 | 3365.38 | 2718 | 2636 | 672.3 |
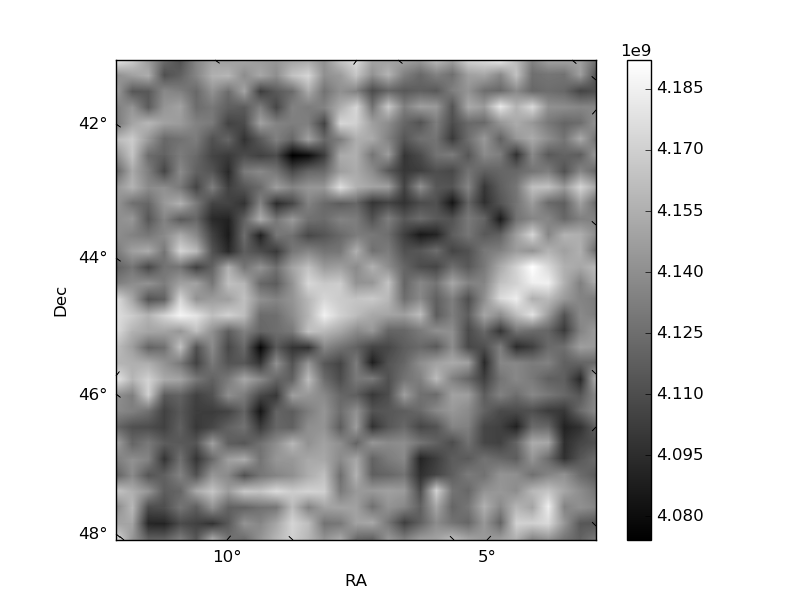
Histogram calculated using DETX and DETY for each event in the final _common_clean file
| Quadrant A |  |
 |
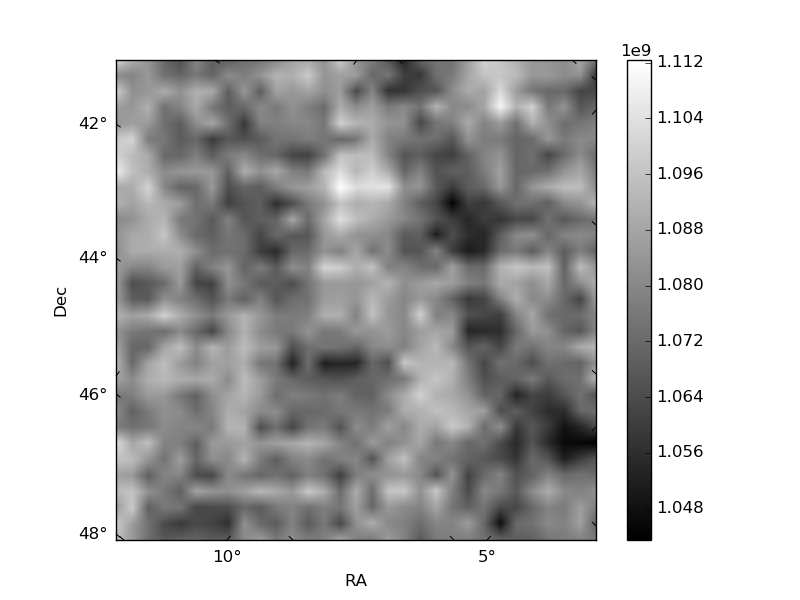
Quadrant B |
|---|---|---|---|
| Quadrant D |  |
 |
Quadrant C |
| Plot type | Count rate plots | Images |
|---|---|---|
| Comparison with Poisson distribution Blue bars denote a histogram of data divided into 1 sec bins. Red curve is a Poisson curve with rate = median count rate of data. |
 |
 |
| Quadrant-wise count rates Data is divided into 100 sec bins |
 |
|
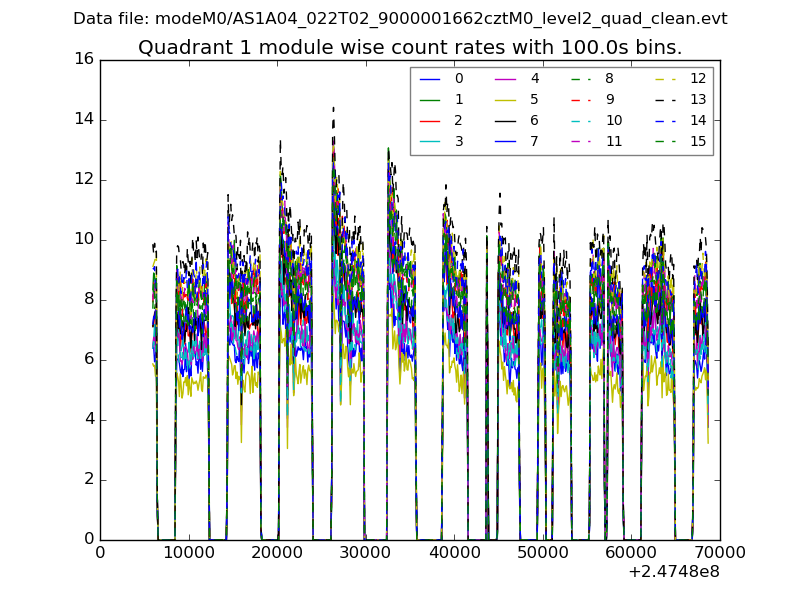
| Module-wise count rates for Quadrant A Data is divided into 100 sec bins |
 |
 |
| Module-wise count rates for Quadrant B Data is divided into 100 sec bins |
 |
 |
| Module-wise count rates for Quadrant C Data is divided into 100 sec bins |
 |
 |
| Module-wise count rates for Quadrant D Data is divided into 100 sec bins |
 |
 |
| Parameter | Plot |
|---|---|
| CZT HV Monitor |  |
| D_VDD |  |
| Temperature 1 |  |
| Veto HV Monitor |  |
| Veto LLD |  |
| Alpha Counter |  |
| _CPM_Rate |  |
| CZT Counter |  |
| +2.5 Volts monitor |  |
| +5 Volts monitor | 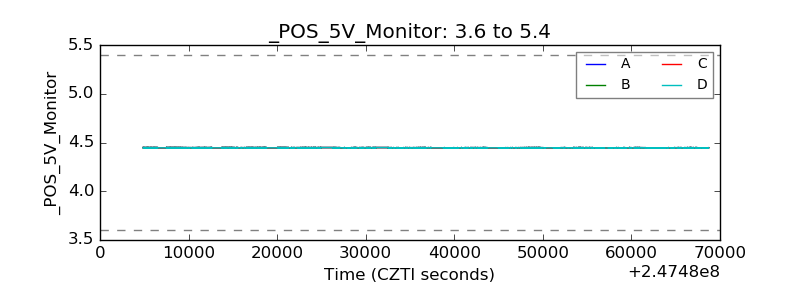 |
| _ROLL_ROT |  |
| _Roll_DEC |  |
| _Roll_RA |  |
| Veto Counter | 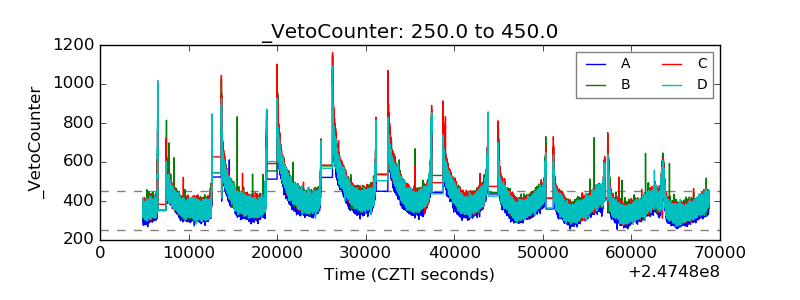 |